
In a week of volatility in both Cryptocurrency and traditional markets, it has become more clear than ever that there exists a correlation between Bitcoin and the traditional financial markets. In a week of volatility in both Cryptocurrency and traditional markets, it has become more clear than ever that there exists a correlation between Bitcoin and the traditional financial markets.”]This trend has been especially clear in Bitcoin and the major indices, but is also clear in some individual stocks and sector ETFs. Many speculated that the correlation between Bitcoin and equities had ceased following an uncharacteristic uptrend for Bitcoin following a market-wide crash for equities, but price activity this week shows that traditional markets may have more of a hold on Bitcoin than estimated.
Let’s take a look at the Bitcoin daily chart for analysis.
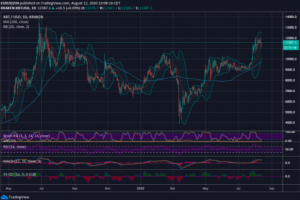
Based on this view, the outlook for Bitcoin is very bullish. It seems to have gone through an accumulation period after raising to over $13k in the middle of last year. It seems poised for more positive price action in the coming months. You’ll notice that there was a sharp drop in March/April, which does correspond with the drop in the stock market not much long after due to the worldwide pandemic. While many consider Bitcoin to be a safe haven like gold is for equities, it did correspond roughly to the moves made by the stock market instead of representing the inverse. However, there still may be some divergence when it comes to the speed of recovery.
Now, let’s take a look at the Dow Jones.
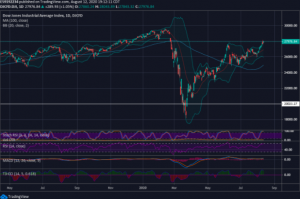
As you can see, the Dow Jones has been heavily impacted and is still more than 10% away from achieving the same level previous to its large drop. Though this structure does remain looking bullish, its gains have significantly lagged those of Bitcoin’s in the same timeframe. Bitcoin suffered the same large drop, but has clearly been the more favorable asset when compared to broad equities. In addition, you’ll notice that this chart does not closely follow the more volatile price action of Bitcoin, though it does move in the same general direction.
Where the strongest correlation has been seen is in Bitcoin and the S&P500 and other relevant tech stocks. Here is a chart over the same time period.
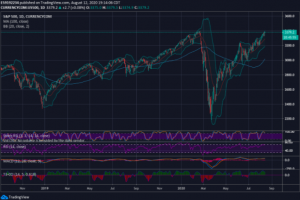
The S&P500 is more volatile than the Dow Jones, and it has recovered more significantly from the lows than the Dow Jones. In fact, it has almost completely recovered from the drop earlier this year and is forming an increasingly bullish structure. It’s clear that Bitcoin does correlate with tech closer than any other traditional asset besides, perhaps, gold.
Though Bitcoin has similar final numbers in terms of gain and recovery, price action seems to be defying what the stock market is doing on a micro level. If you are looking for a correlation in the two assets, it seems to lie in the highs and lows when the two assets make drastic moves. However, Bitcoin seems to be overall pacing the recovery faster than stocks, which bodes well for the cryptocurrency market as a whole.


