
Bitcoin and the altcoins are are in downward correction but making positive moves to the upsides. The cryptocurrencies’ upward moves are hampered because of the resistance in their respective overbought regions. The uptrend will commence once the resistance levels are breached. In the meantime, the cryptos have retraced after an initial resistance in the overbought region.
BTC/USD Major Trend: Bearish
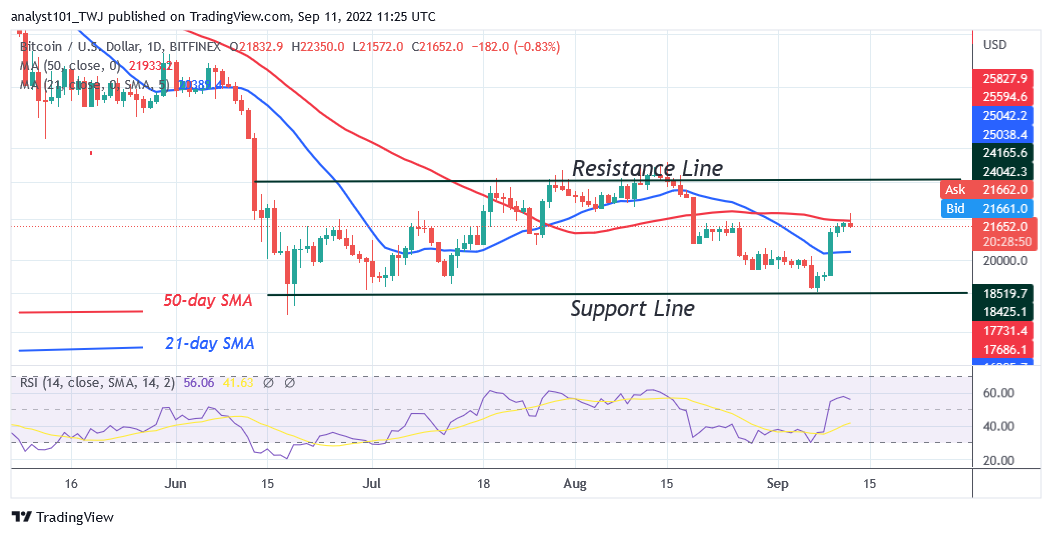
Bitcoin’s (BTC) price is in a downward correction as the cryptocurrency rallied above the moving average lines but it is stuck at the 50-day line SMA. In other words, the BTC price rallied to the high of the $22,000 resistance zone. Buyers could not sustain the bullish momentum as Bitcoin reached the overbought region of the market. The largest cryptocurrency would have rallied to the $24,000 overhead resistance if the resistance at $22,000 was breached. On the downside, the BTC price is likely to decline above the 21-day line SMA.
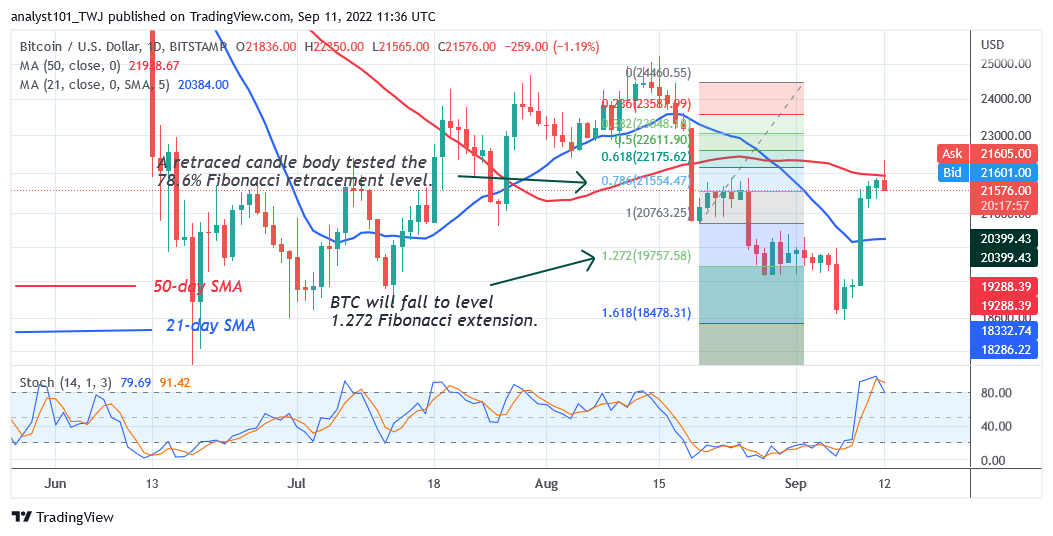
Bitcoin will decline and be compelled to a range-bound move between the moving average lines if the 21-day line SMA support holds. Nonetheless, if the crypto declines below the 21-day line SMA, Bitcoin will revisit the previous price level at $18,675. Bitcoin is at level 56 of the Relative Strength Index for period 14. It indicates that Bitcoin is in the uptrend zone and may further rise. However, BTC price is above the 80% range of the daily Stochastic. It indicates that the cryptocurrency has reached the overbought region.
SAND/USD Major Trend: Bearish
The Sandbox (SAND) price is in a downward correction as the altcoin faces further rejection. Since November 2021, the SAND has been on a downward move. On September 10, buyers pushed the altcoin above the 21-day line SMA but faced rejection at the recent high.
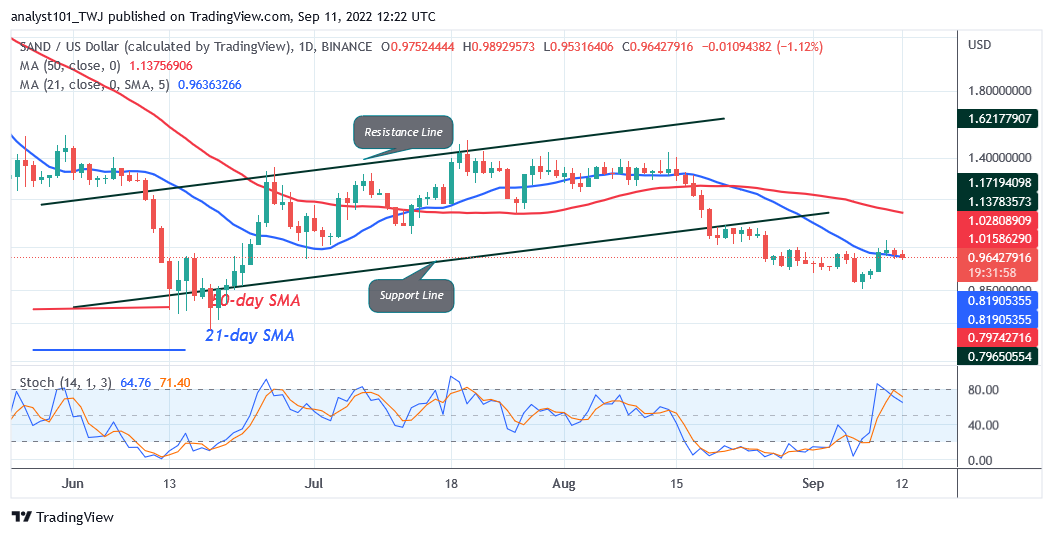
The cryptocurrency is facing selling pressure as it declines above the 21-day line SMA. The SAND will be compelled to a range-bound move if the 21-day line SMA holds. The altcoin will rise and retest the 50-day line SMA. In other words, the crypto’s price will be fluctuating between the moving average lines. Presently, the bears are attempting to break below the 21-day line SMA. A break below the 21-day line SMA will cause the altcoin to decline to the previous low at $0.87. SAND is below the 80% range of the daily stochastic. It indicates that the altcoin is in a bearish momentum.
MANA/USD Major Trend: Bearish
Decentraland (MANA) price is in a downward correction but fluctuates between the moving average lines. The crypto’s price is above the 21-day line SMA but the price movement is stagnant because of the presence of a small body indecisive candlestick.

This week, MANA will be compelled to a range-bound move between the moving average lines if the current support holds. Nevertheless, if the bears break below the 21-day line SMA, MANA will decline to $0.72 low. MANA is at level 45 of the Relative Strength Index for period 14. It indicates that MANA is in the downtrend zone despite the upward correction. The cryptocurrency risks further decline to the downside.
APE /USD Major Trend: Bearish
ApeCoin’s (APE) price is in a downward correction as it rallied above the moving average lines. However, buyers could not sustain the bullish momentum above the 50-day line SMA as the coin reaches the overbought region. The cryptocurrency is declining as it fluctuates between the moving average lines.
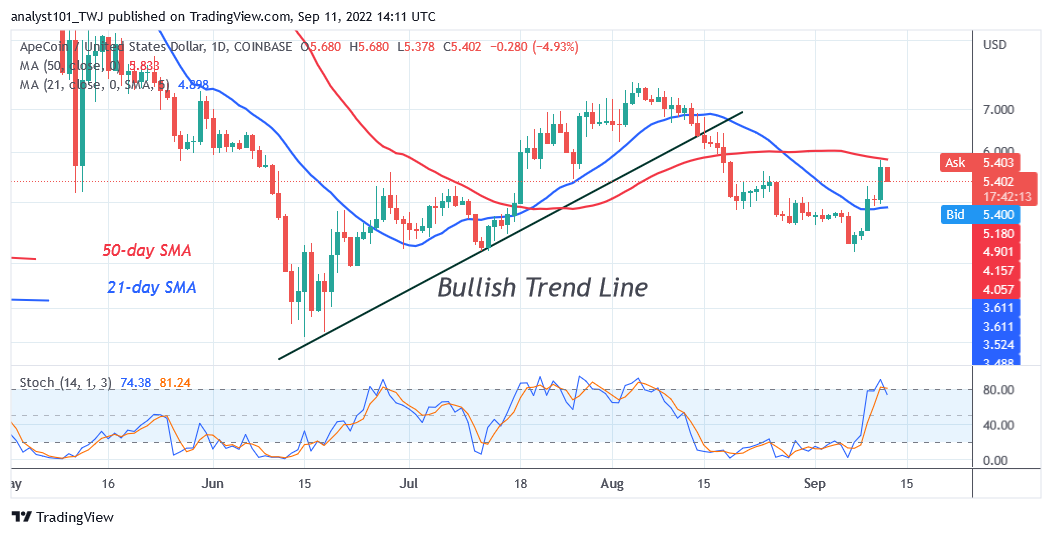
Buyers are attempting to push APE to retest or break the resistance at $7.00. A break above the resistance will signal the resumption of the uptrend. However, the altcoin will resume downward correction if the bears break below the 21-day line SMA. ApeCoin is below the 80% range of the daily Stochastic. The altcoin has reached the oversold region of the market. Sellers have emerged in the overbought region to push prices down.
ENJ /USD Major Trend: Bearish
Enjin Coin (ENJ) price is in an upward correction as it breaks above the 21-day line SMA. The crypto’s price is rising to retest or break the 50-day line SMA. A break above the 50-day SMA will signal the resumption of the uptrend. The altcoin will rise and revisit the overhead resistance at $0.75.
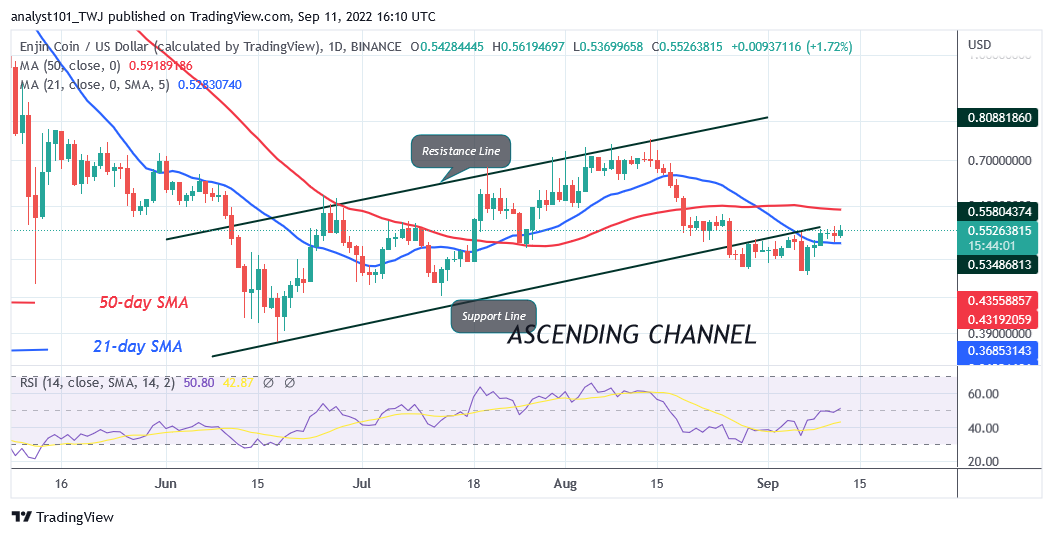
On the upside, Enjin Coin will rise to the highs of $0.77 and $1.18 if the resistance at $0.75 is breached. Conversely, if the bulls failed to break the 50-day line SMA, ENJ /USD will be compelled to a range-bound move between the moving average lines.ENJ is at level 51 of the Relative Strength Index for period 14. It indicates that ENJ is in the bullish trend zone. Also, it indicates that there is a balance between supply and demand.


