
For the past week, BTC/USD has been in a downward correction after the recent breakdown. Bitcoin consolidates above $44,000 but struggles below $47,000 resistance. A breakout at the resistance will catapult the crypto above the $50,000 psychological price level. Ripple and the other Altcoins are facing a similar downward correction except for Polkadot which is likely to make impressive moves this week.
BTC/USD Major Trend: Bullish
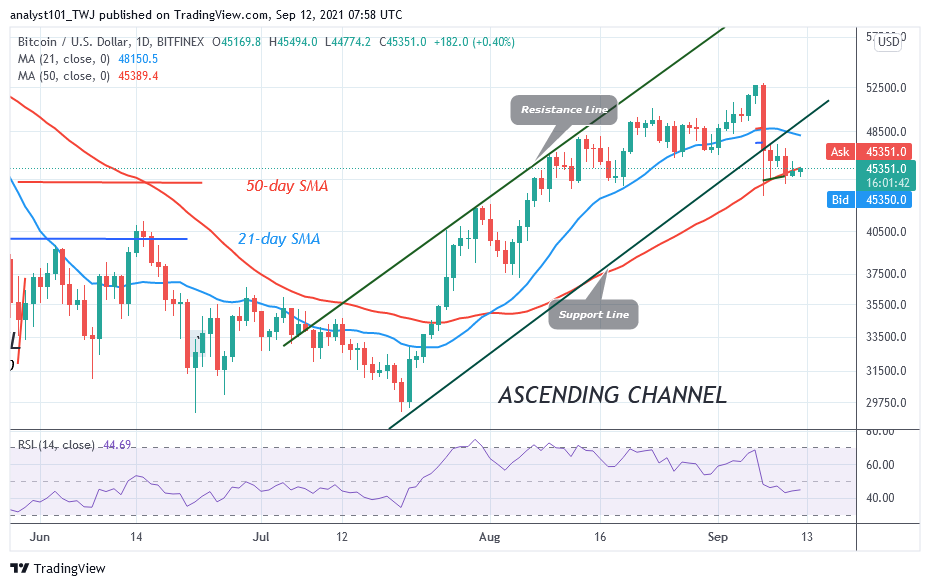
Today, BTC’s price is consolidating above $44,000 as the bearish impulse subsides. For the past week, BTC/USD has been fluctuating between $44,000 and $47,000. Buyers have defended the current support as the crypto resumes upward. BTC price has broken above the 50-day SMA as price reaches the 21-day SMA. BTC/USD will resume upside momentum if price breaks above the $47,000 high. However, if buyers fail to break above the resistance at $47,000, Bitcoin will be compelled to resume the range-bound move.
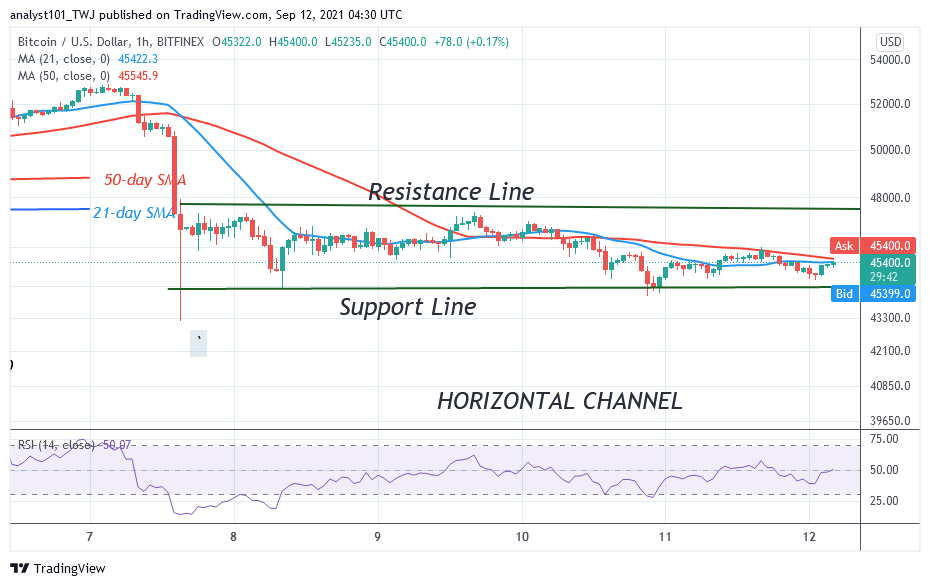
The range-bound move has been characterized by small body indecisive candlesticks called Doji and Spinning tops. The candlesticks are indicating that buyers and sellers have reached a period of indecision. They are undecided about the direction of Bitcoin. In the meantime, Bitcoin has resumed upward to revisit the previous highs.
XRP/USD Major Trend: Bearish
On September 7 breakdown, XRP plunged from the high of $1.41 to the low of $0.92. After the bearish impulse, the bulls bought the dips to push the altcoin to $1.15 high. Buyers could not continue with the upward correction as XRP was repelled to a range-bound move.
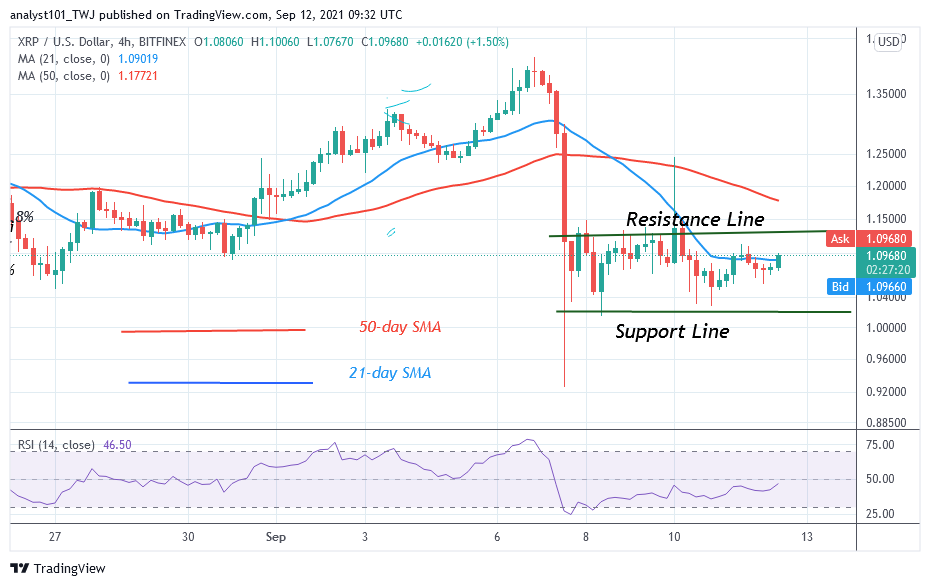
Ripple is now fluctuating between levels $1.01 and $1.15. The crypto has been in a downward correction after the recent breakdown. Sellers have made three attempts to break below the support but were repelled. On the upside, if buyers break above $1.15 resistance, XRP will have an accelerated price movement. The crypto will rally to the high of $1.40.
DOT/USD Major Trend: Bullish
Following the September 7 breakdown, DOT/USD has made upward correction twice. In the first uptrend, DOT price corrected to the high of $32 but was repelled as the altcoin pulled back to $28 low. In the second uptrend, DOT price is retesting the same resistance level to break above it.
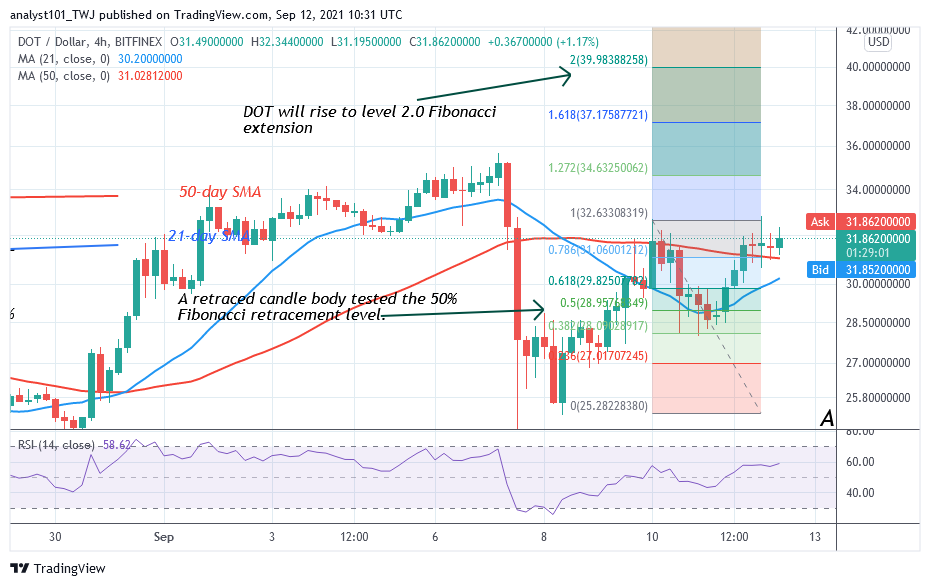
The altcoin will resume trending if any of the range-bound levels are broken. For instance, the selling pressure will continue, if the bears break below the previous low of $22.50. On the upside, if DOT price breaks above the $32 resistance and the bullish momentum is sustained, the uptrend will resume. Meanwhile, on the September 9 uptrend, a retraced candle body tested the 50% Fibonacci retracement level. The retracement indicates that DOT will rise to level 2.0 Fibonacci extension or level $39.98.
LTC /USD Major Trend: Bullish
Litecoin (LTC) is in a downward correction as it consolidates above $170. Since September 7, the LTC price has fluctuated between $170 and $192.
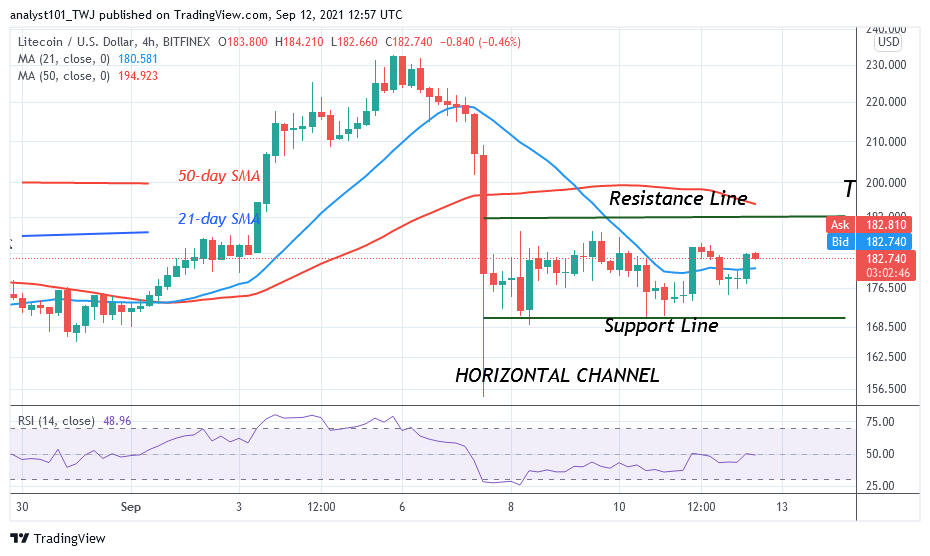
The uptrend will resume if the current support holds. For instance, if buyers breach the resistance at $192, the altcoin will rally to $230 high. Conversely, if the bears break the current support, LTC/USD will further decline. This will catapult the altcoin to reach the low of $156.
LINK /USD Major Trend: Bullish
Today, Chainlink’s (LINK) price rebounded above the $26.50 support as the altcoin resumes upward move. This will be the second time; LINK price will be retesting the resistance at $30.
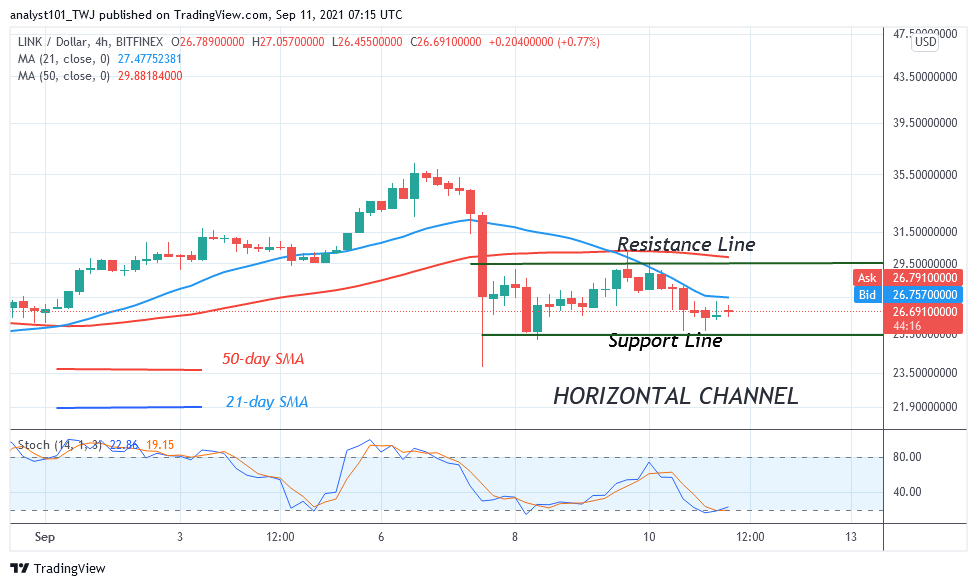
For the past week, the altcoin has been confined between $25 and $30. If buyers breach the resistance at level $30, the market will rally above $35 high. The bullish momentum is likely to continue on the upside. However, if the altcoin faces rejection at the recent high, Chainlink will fall and find support above $30 support.


