
Bitcoin and the altcoins have continued to slide down after encountering selling pressure at the recent highs. BTC’s price failed to break above the 21-day line SMA which is the major cause of its decline. The largest cryptocurrency will cause panic buying and selling if it declines below the $17,605 support. Let us examine all the cryptos below:
BTC/USD Major Trend: Bearish
Bitcoin’s (BTC) price is in a downtrend as it resumes an upward correction. On September 19, the upward correction reached the high of $19,694 and was repelled. BTC price declined and resumed a sideways move.
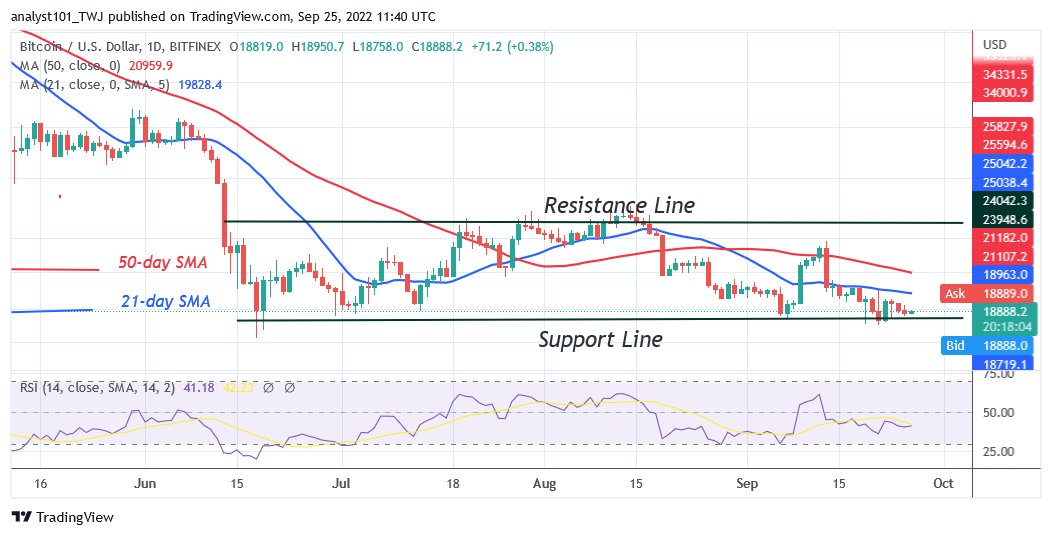
On September 21, the coin rebounded and reached a high of $19,981. Buyers have failed to breach the $20,000 psychological price level and the 21-day line SMA. The upward correction could have continued if the 21-day line SMA is broken. On the upside, buyers have failed to break above the moving average lines and revisit the overhead resistance at the $25,205 high.
On the downside, sellers will attempt to revisit the current support at $18,675. Nonetheless, if the bears breach the current support, Bitcoin will decline to the previous low at $17,605. Buyers will attempt to defend the $17,605 support if Bitcoin declines to the previous low. However, a break below $17,605 support will cause Bitcoin to reach the low of $14,500. This will create panic buying and selling of Bitcoin if buyers fail to stall the decline.
SAND/USD Major Trend: Bearish
The Sandbox (SAND) price is in a downtrend but has resumed an upward correction. On September 23, the cryptocurrency turned down from the 21-day line SMA indicating further downward movement of the coin. Meanwhile, on September 7 downtrend; a retraced candle body tested the 78.6% Fibonacci retracement level.
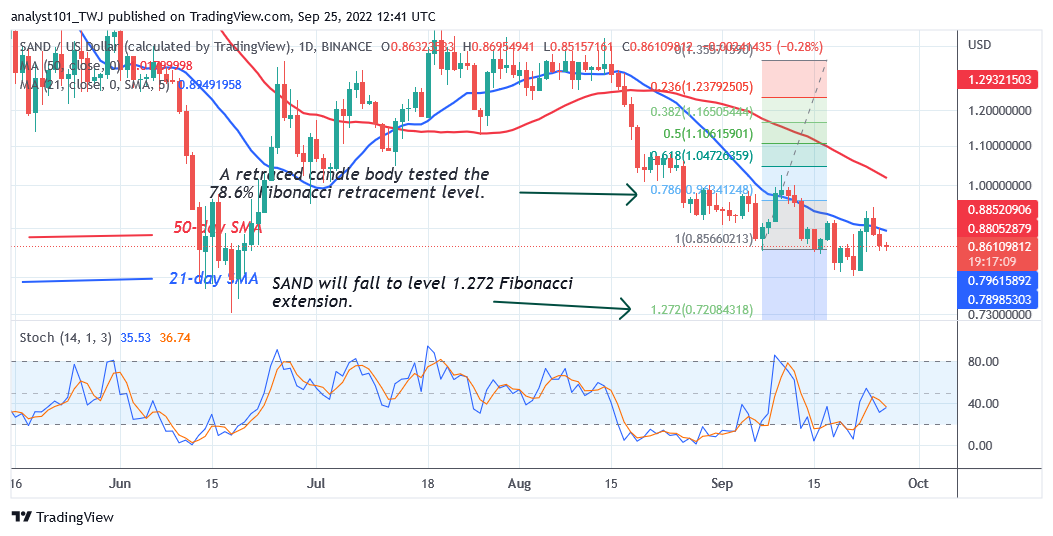
The retracement indicates that SAND will fall to level 1.272 Fibonacci extension or $0.72 price level. On the downside, if the altcoin declines to $0.72 support, it will encounter a price rebound. On June 19, the altcoin rebounded above the moving average lines and reached the high of $1.47 price level. The altcoin is below the 40% range of the daily Stochastic. The altcoin is in a bearish momentum.
MANA/USD Major Trend: Bearish
Decentraland (MANA) price is in a downtrend as it continues its downward move to the low of $0.69. Since September 13, the altcoin has been in a downward move after the rejection at the 21-day line SMA.
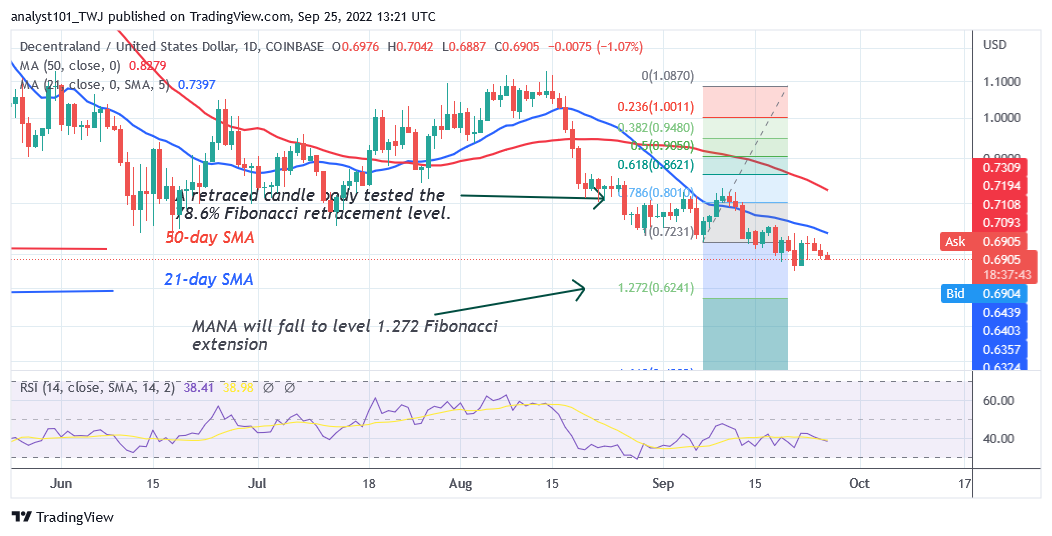
The bears have broken the previous low of June 13 as the altcoin continues its declines to the oversold region. Meanwhile, on September 7 downtrend; a retraced candle body tested the 78.6% Fibonacci retracement level. The retracement indicates that MANA will fall to level 1.272 Fibonacci extension or $0.62 price level. MANA is at level 37 of the Relative Strength Index for period 14. It indicates that the cryptocurrency is in a bearish momentum.
APE /USD Major Trend: Bearish
ApeCoin’s (APE) price is in an upward correction as price breaks above the moving average lines. The upward correction is facing resistance at the $6.00 high. On the upside, if buyers breach the $6.00 resistance level, APE will revisit the $7.71 high.
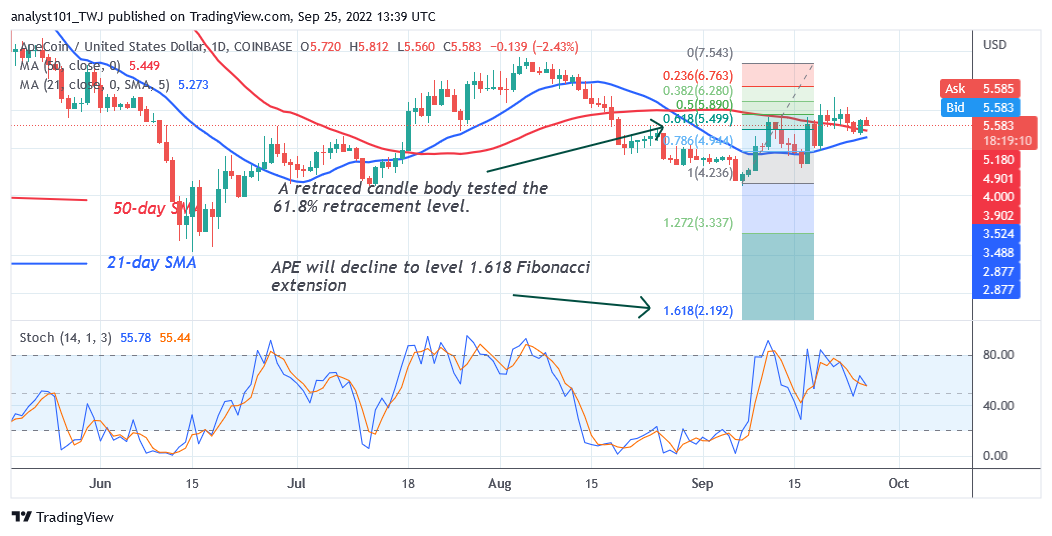
The selling pressure will resume if the altcoin faces rejection at the $6.00 high. Meanwhile, on September 7 downtrend; a retraced candle body tested the 61.8% Fibonacci retracement level. The retracement indicates that APE will fall to level 1.618 Fibonacci extension or $2.19 price level. The altcoin is below the 80% range of the daily Stochastic. ApeCoin is in a bearish momentum.
ENJ /USD Major Trend: Bearish
Enjin Coin (ENJ) price is in a downtrend as the altcoin faces rejection at the $0.70 high. The bears have broken below the moving average lines. Further upward moves are being repelled at the 21-day line SMA. Meanwhile, on September 8 downtrend; a retraced candle body tested the 78.6% Fibonacci retracement level.
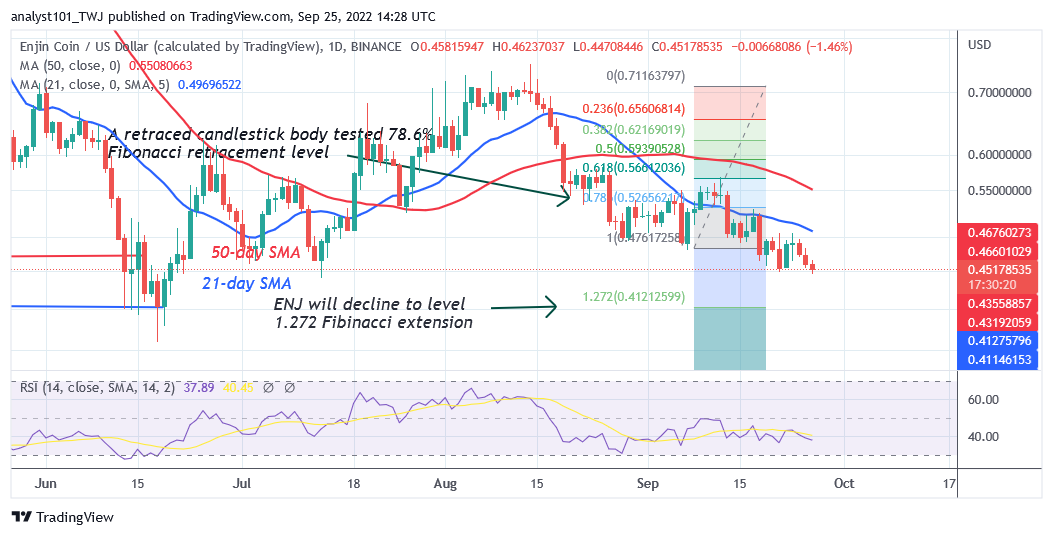
The retracement indicates that ENJ will fall to level 1.272 Fibonacci extension or $0.41 price level. Meanwhile, on September 7 downtrend; a retraced candle body tested the 78.6% Fibonacci retracement level. The retracement indicates that ENJ will fall to level 1.272 Fibonacci extension or $0.41 price level. ENJ is at level 37 of the Relative Strength Index for period 14. It indicates that ENJ is in the downtrend zone and capable of a further downward move.


