
Bitcoin and the altcoins are in a downtrend and have continued to fall as the cryptocurrencies revisit their previous lows. Bitcoin is approaching the critical support levels at $18,675 and $17,605. The bulls have to defend the current levels to avoid panic buying and selling. Let us the discuss Bitcoin and the other altcoins in detail.
BTC/USD Major Trend: Bearish
Bitcoin’s (BTC) price is in a downtrend as it declines to the low of $19,350.10. On September 17, buyers attempted to push BTC price above the 20-day line SMA but were repelled. On the upside, if buyers were successful, the BTC price would have rallied to the 50-day line SMA.
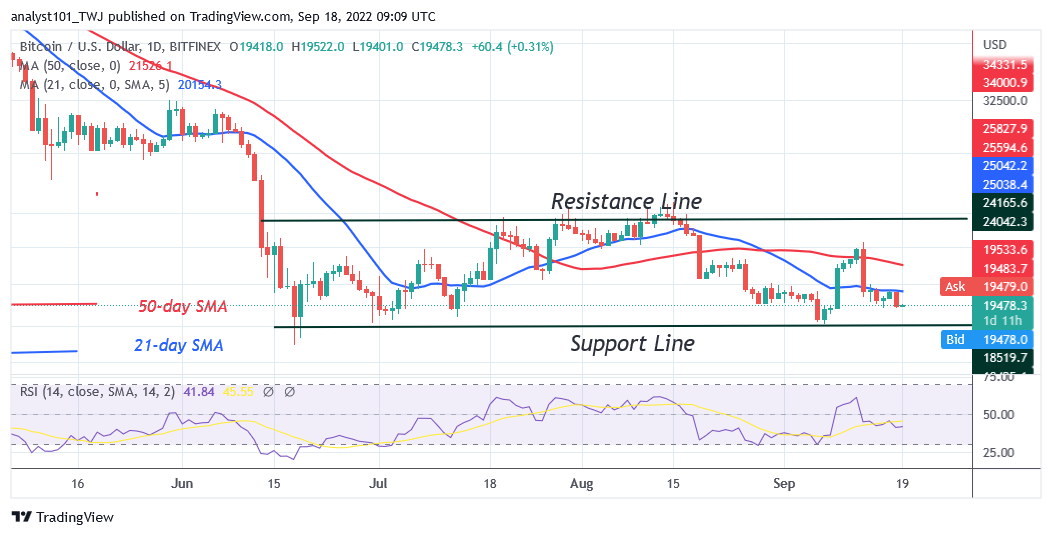
That is, Bitcoin would have reached the $22,794 resistance zone. Today, the largest cryptocurrency has continued its decline to the previous low. Bitcoin will revisit the previous low of September 6, if the selling pressure persists. In other words, the market will decline to the low of $18,675 and $18,638 price levels. This is the historical price level on June 30. The crypto will decline to the last crucial support at $17,605 if the support at $18,675 is breached.
These levels will witness panic buying by the bulls to push the coin upward. However, the failure of the bulls to defend the current support will cause Bitcoin to resume another round of downtrends. Bitcoin is at level 41 of the Relative Strength for Period 14. The cryptocurrency is in the downtrend zone and may further decline.
SAND/USD Major Trend: Bearish
The Sandbox (SAND) price is in a downtrend as the altcoin declines below the moving average lines. The altcoin is likely to decline to the previous low at $0.73. In previous price action, buyers could not sustain the bullish momentum above the $1.40 overhead resistance.
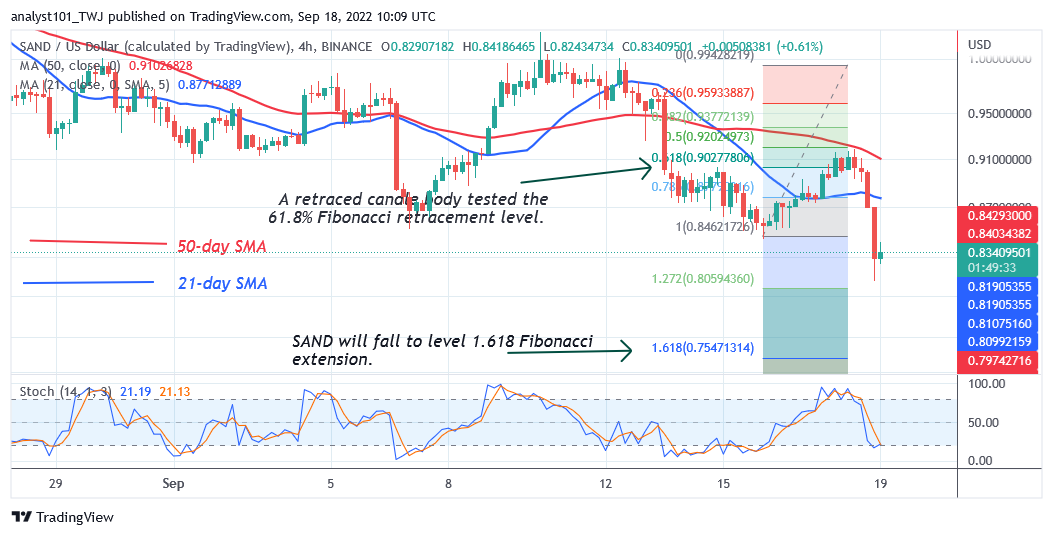
Since August 15, the Sandbox has been on a decline after rejection from the overhead resistance. Meanwhile, on September 15 downtrend; a retraced candle body tested the 61.8% Fibonacci retracement level. The retracement indicates that SAND will fall to level 1.618 Fibonacci extension or $0.0.75 price level. The altcoin is below the 20% range of the daily Stochastic. The altcoin has reached the oversold region of the market. The selling pressure has reached bearish exhaustion. Buyers will emerge in the oversold region to push prices upward.
MANA/USD Major Trend: Bearish
Decentraland (MANA) price is in a downtrend as price breaks below the moving average lines. The cryptocurrency has declined to the low of $0.68 and may further decline to the previous low. The bears have broken below the current support at $0.70.
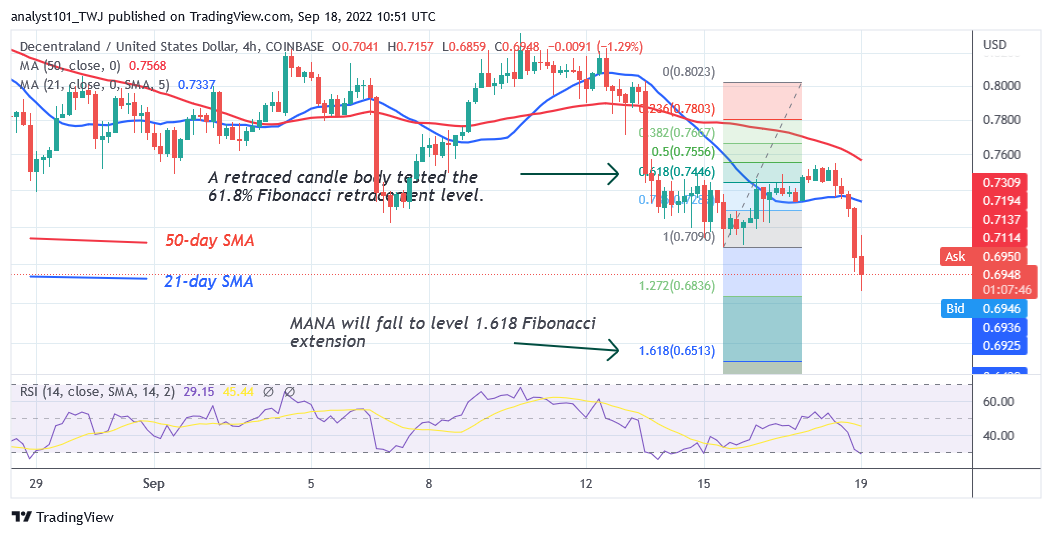
The upward correction was repelled at the high of level $0.82, hence the selling pressure. Meanwhile, on September 15 downtrend; a retraced candle body tested the 61.8% Fibonacci retracement level. The retracement indicates that MANA will fall to level 1.618 Fibonacci extension or $0.0.65 price level. MANA is at level 28 of the Relative Strength Index for period 14. It indicates that it has fallen to the oversold region of the market. The selling pressure will subside as buyers emerge in the oversold region.
APE /USD Major Trend: Bearish
ApeCoin’s (APE) price is in a downward correction as the altcoin is confined between the moving average lines. Since September 9, the bulls and bears have struggled to break the moving average lines. The altcoin will trend once the moving average lines are breached.
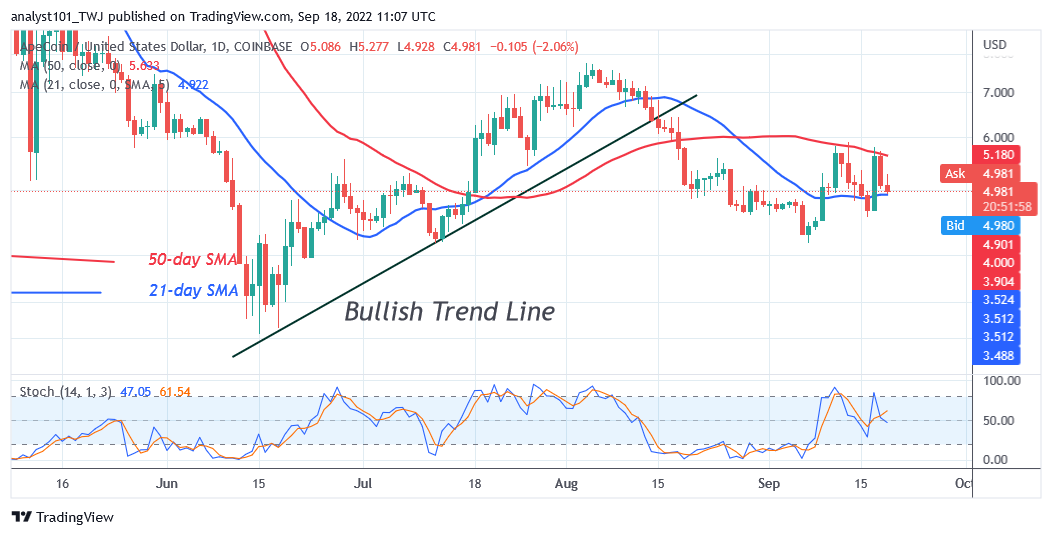
For instance, if the bulls breach the 50-day line SMA, the altcoin will rise and retest the $8.0 resistance zone. The uptrend will resume if price breaks above the resistance zone. Conversely, if the bears break below the 21-day line SMA, the selling pressure will resume. The coin will decline to the previous low at $4.17 or $3.20 price level. The altcoin is below the 80% range of the daily Stochastic. ApeCoin is likely to resume selling pressure as it is in the bearish momentum.
ENJ /USD Major Trend: Bearish
Enjin Coin (ENJ) price is in a downtrend as it breaks below the moving average lines. The cryptocurrency was earlier in an upward correction. The bulls could not sustain the bullish momentum above the $0.70 resistance level, hence the current selling pressure.
Meanwhile, on September 15 downtrend; a retraced candle body tested the 61.8% Fibonacci retracement level. The retracement indicates that ENJ will fall to level 1.618 Fibonacci extension or $0.44 price level.ENJ is at level 26 of the Relative Strength Index for period 14. It indicates that ENJ has fallen to the oversold region of the market. The current selling pressure may subside.


