
Bitcoin and the other cryptos have resumed selling pressure after price broke below the moving averages. Bitcoin is in a downward correction as price fluctuates between $40,000 and $45,000 price levels. For the past week, BTC’s price has been stable above the $42,000 price level. Ripple and the other altcoins are in a downward correction as bulls hold crucial support levels.
BTC/USD Major Trend: Bearish
For the past week, BTC/USD has been trading above the $40,000 psychological price level. On September 21, Bitcoin plunged to $39,678 as bulls bought the dips. Buyers held the BTC price level from sinking below the $40,000 price level.
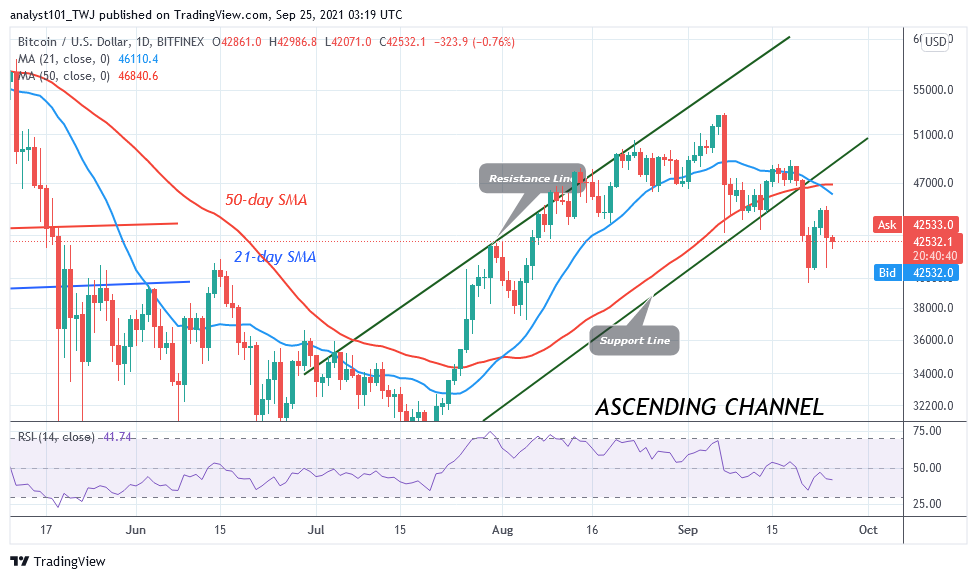
For the five days, the bulls have succeeded in defending the current support as Bitcoin was compelled to a range-bound move above the current support. Bitcoin’s upward move is dependent upon buyers breaching the $45,000 and $48,800 resistance levels. A breakout above these previous highs will catapult Bitcoin above the $50,000 high. The crypto is fluctuating between levels $40,000 and $45,000 as Bitcoin trades in the bearish trend zones. If the bears break below the $40,000 support, the downtrend is likely to resume. Bitcoin will decline to the low of $38,000.
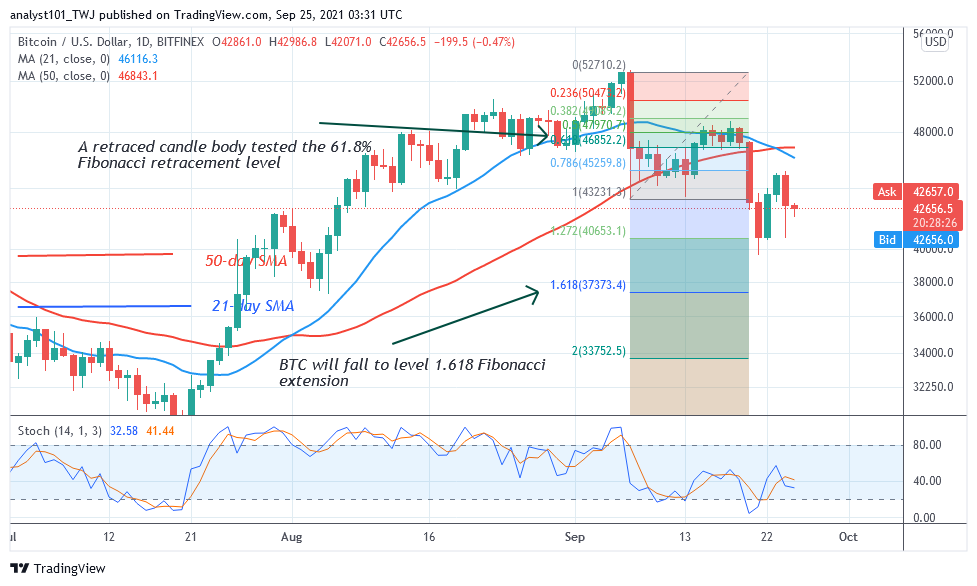
Meanwhile, on September 7 downtrend; a retraced candle body tested the 61.8% Fibonacci retracement level. The retracement indicates that BTC price will fall to level 1.618 Fibonacci extension or level $37,373.40. From the price action, BTC’s price has been stable above $42,000 support.
XRP/USD Major Trend: Bearish
Following the last bearish impulse on September 21, the XRP price has been trading between 0.80 and $1.00 price levels. The bears have broken below the previous low at $0.92 as bulls bought the dips. Buyers attempted to push the XRP price above the previous high but were repelled at $1.00 high.
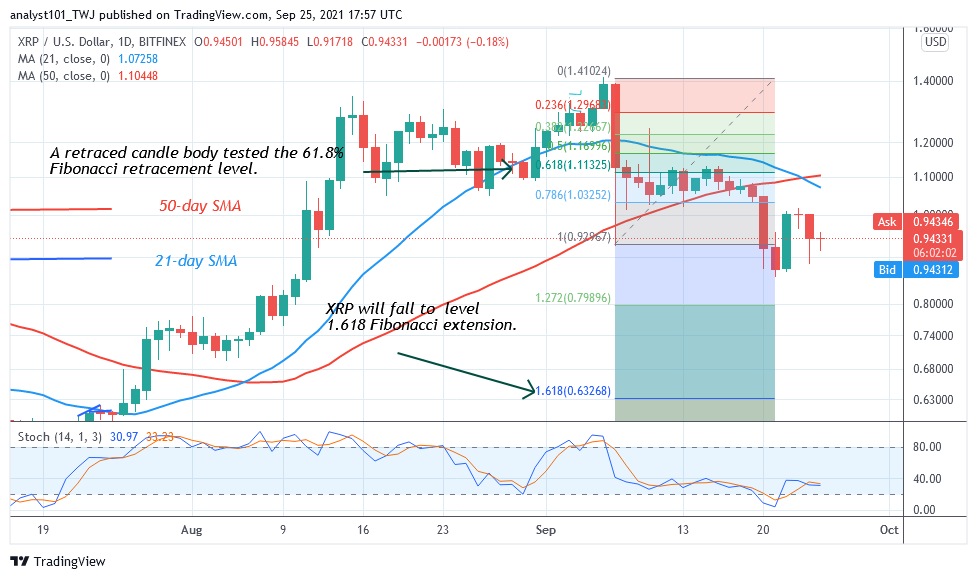
This gives the impression that the selling pressure is likely to continue on the downside. Meanwhile, on September 7 downtrend; a retraced candle body tested the 61.8% Fibonacci retracement level. The retracement indicates that XRP will fall to level 1.618 Fibonacci extension or level $0.63. From the price action, the XRP price is hovering above the previous low at $0.92. If the bears break below the previous low and the bearish momentum is sustained, the market will decline to level 1.618 Fibonacci extension or level $0.63. The upward move will resume if the current support holds and buyers push XRP price above the resistance levels of $1.00 and $1.10.
DOT/USD Major Trend: Bullish
For the past week, Polkadot’s (DOT) price has been making positive moves but could not sustain above the $34 resistance level. DOT price faced rejection at the recent high as the altcoin resumed selling pressure. DOT price has fallen above the $29 support and it is fluctuating between the 21-day and 50-day SMAs. If price bears break below the 50-day SMA, the downtrend will resume.
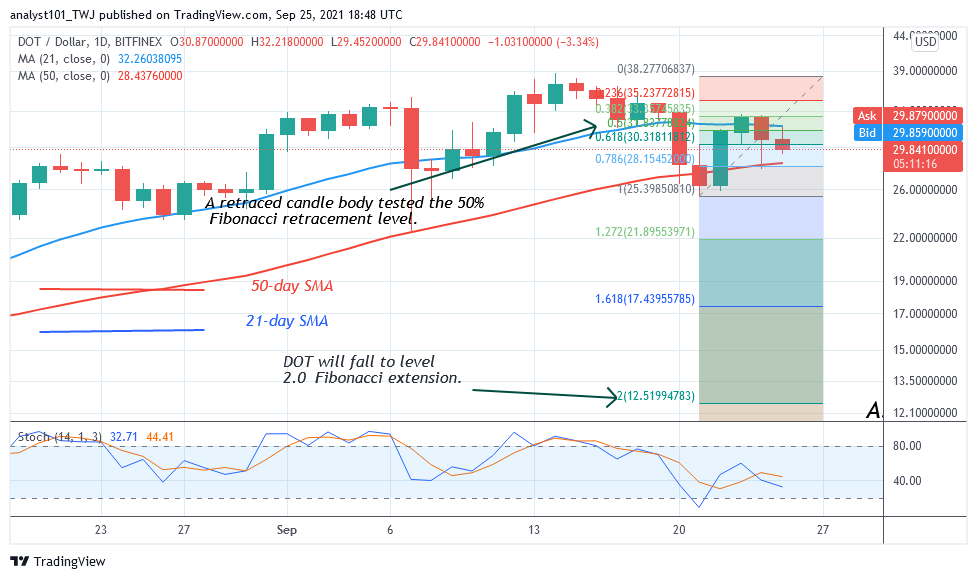
Similarly, if price breaks above the 21-day SMA, the DOT price will resume an upward move. Meanwhile, on September 21 downtrend; a retraced candle body tested the 50% Fibonacci retracement level. The retracement indicates that DOT will fall to level 2.0 Fibonacci extension or level $12.51. The Fibonacci tool analysis will hold if the 50-day SMA is breached.
LTC /USD Major Trend: Bearish
Litecoin’s (LTC) price has continued its downward move as price breaks below the moving averages. After September 21 bearish impulse, Litecoin fell to the low of $144 and pulled back. For the past five days, the bears have been struggling to break below the $155 support.
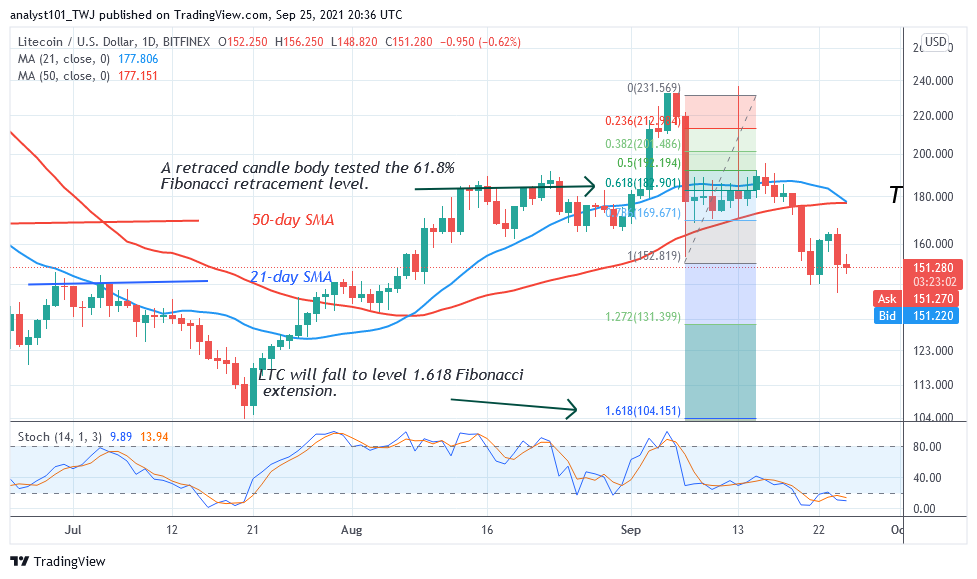
If the bears break below the $155 support and the bearish momentum is sustained, the LTC price will decline to either $138 or 106 low. Meanwhile, on September 7 downtrend; a retraced candle body tested the 61.8% Fibonacci retracement level. The retracement indicates that LTC will fall to level 1.618 Fibonacci extension or level $104.15. However, if price rebounds and breaks above the $180 high, it will signal the resumption of the uptrend.
LINK /USD Major Trend: Bearish
Chainlink’s (LINK) price has fallen to the bearish trend zone after breaking below the moving averages. The altcoin fell to $20.86 low as bulls bought the dips. Since September 21, LINK’s price has been fluctuating between $21 and $26 high. Chainlink may fall to the low of $14 if the bears breach the $21 support, otherwise, the uptrend will resume upward.
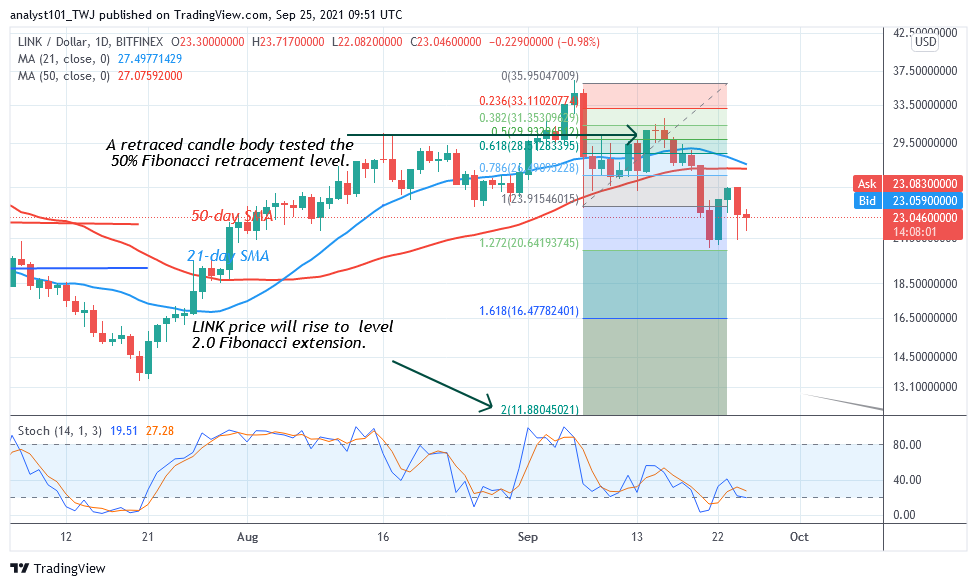
Nevertheless, if the bulls breach the $26 high and the bullish momentum is sustained, LINK/USD will commence upside momentum. Meanwhile, on September 7 downtrend, a retraced candle body tested the 50% Fibonacci retracement level. The retracement indicates that LINK will fall to level 2.0 Fibonacci extension or level $11.88. The Fibonacci tool analysis will hold if price breaks below the 50-day SMA.


