
Bitcoin and the other cryptos are declining from their overhead resistance levels. This is because the bears have continued to sell at a higher price levels. The cryptos lack sufficient buyers at higher price levels to breach the recent highs. Let us discuss in detail the cryptocurrencies below.
BTC/USD Major Trend: Bearish
Since July 13, Bitcoin’s (BTC) price has been making positive moves to the upsides. Today, the BTC price has risen to the high of $21,666 but it facing rejection at the $22,000 resistance zone. In the first uptrend, Bitcoin was repelled at the $22,425 high on July 8.
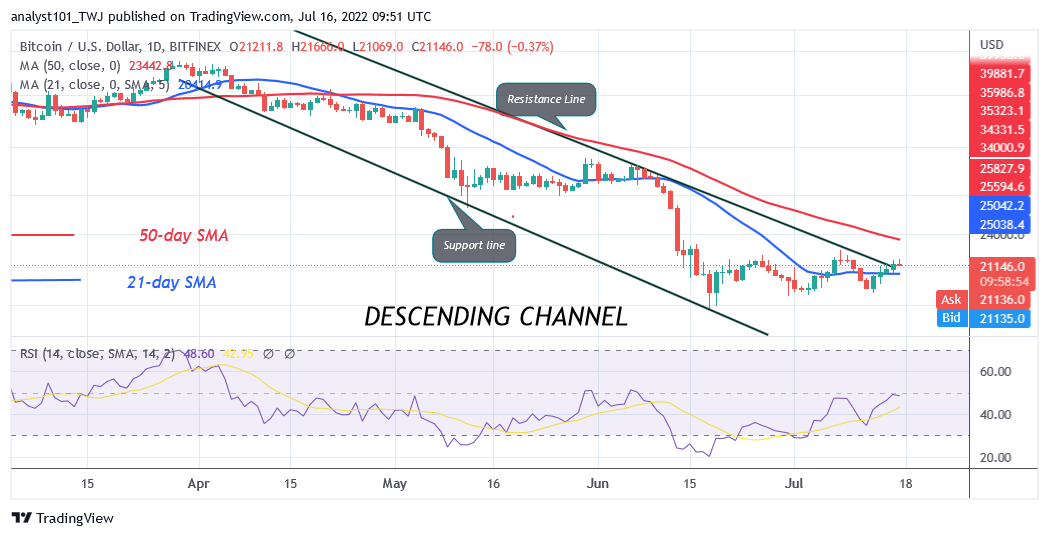
Nevertheless, if buyers overcome the $22,000 resistance, the market will rally to the next resistance of $23,010. A break above the $23,010 resistance will push Bitcoin to rally above the 50-day line SMA. In other words, Bitcoin will resume upside momentum as it targets the $30,000 high. However, buyers’ ability to overcome the recent high is doubtful because of the presence of a long candlestick wick. The candlestick wick indicates strong selling at a higher price level. The current uptrend may face stiff resistance at the recent high.
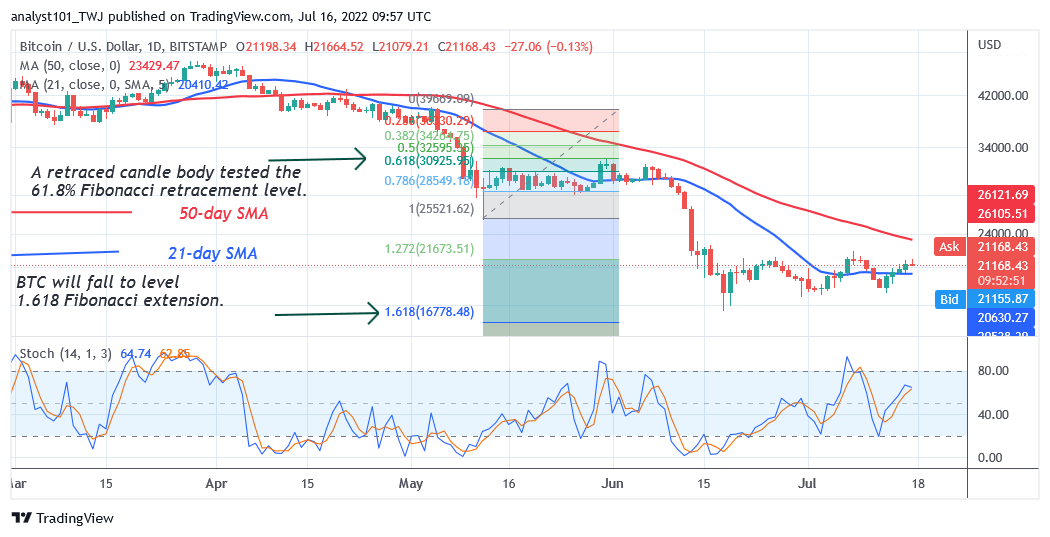
However, the bullish scenario will be invalidated if the BTC price faces another rejection at the $22,000 resistance zone. Sellers will attempt to push BTC prices below the 21-day line SMA. This will cause Bitcoin to fall above the $20,000 psychological price level. A break below the $20,000 support will cause the BTC price to revisit the previous low at the $17,605 price level. Meanwhile, Bitcoin is at level 48 of the Relative Strength Index for period 14. It indicates that Bitcoin is in a downtrend zone because of the recent retracement.
SAND/USD Major Trend: Bearish
The Sandbox (SAND) price is in a downward correction as price breaks above the moving average lines. The moving average lines are horizontally flat indicating a possible range-bound move of the cryptocurrency.
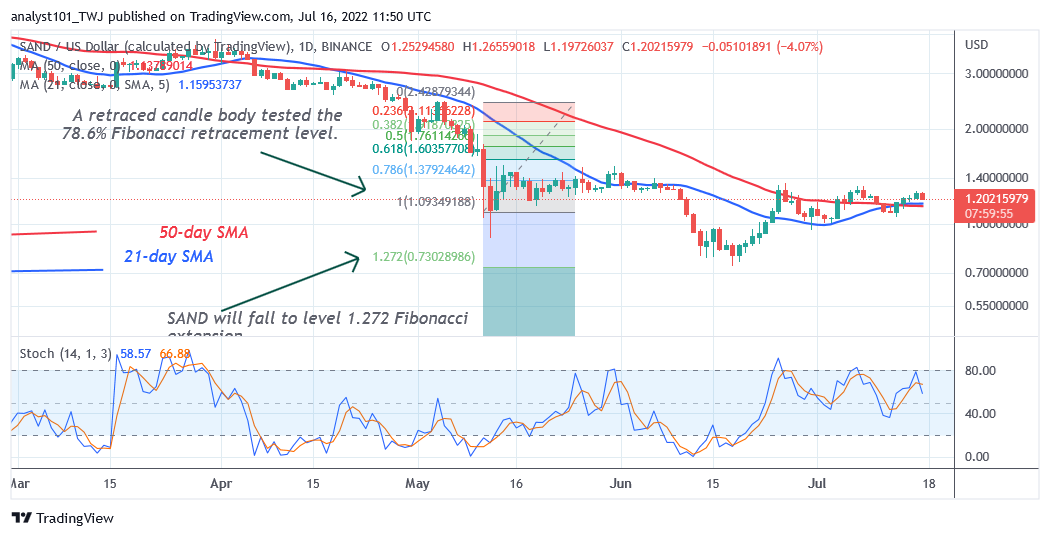
The price action is characterized by a small body indecisive candlestick called Doji candlestick. This candlestick indicates that buyers and sellers are undecided about the direction of the market. In the meantime, the cryptocurrency is in a sideways move. It is fluctuating between $1.00 and $1.40 price levels. The cryptocurrency will decline to the previous low at $0.73 if the $1.00 support is breached. On the upside, if the bulls break above the $1.40 high, SAND will rally to $1.50 or $2.50 price levels.
MANA/USD Major Trend: Bearish
Decentraland (MANA) price is in a downward correction as price breaks below the moving average lines. On July 13, the uptrend faced resistance at the moving average lines. The 21-day line SMA has restrained a further upward movement of the cryptocurrency.
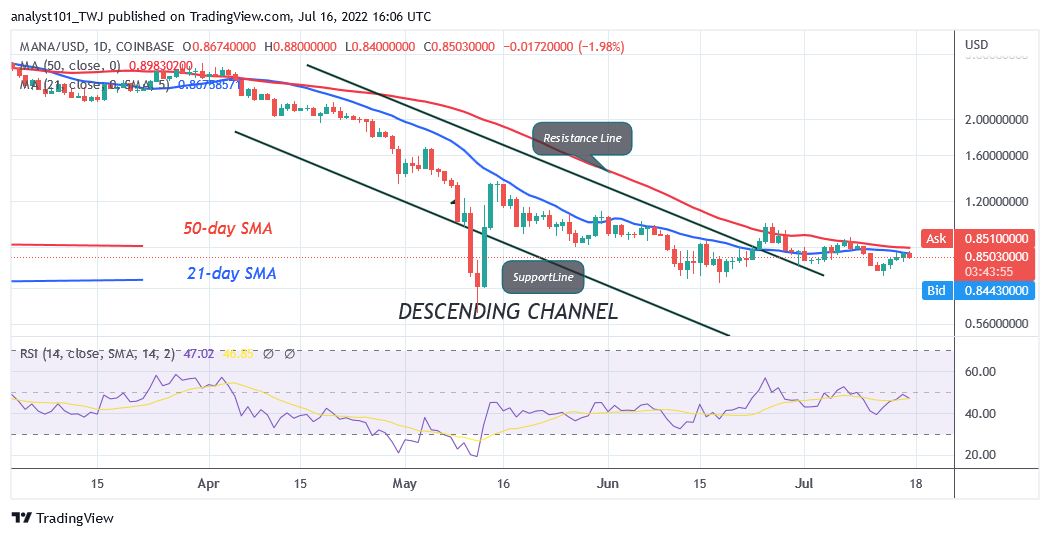
Today, MANA is facing resistance at the 21-day line SMA. The altcoin is declining from the high of $0.88. On the downside, if the selling pressure persists, the market will decline to the low of $0.72 price level. However, if the selling pressure persists the bears will attempt to sink the coin to the previous low of $0.59. Nonetheless, if the current support holds, the market will be fluctuating between $0.72 and $0.88 price levels.
APE /USD Major Trend: Bearish
ApeCoin’s (APE) price is in a downward correction as price breaks above the moving average lines. Today, the coin is trading at $5.04 at the time of writing. On the upside, if the bulls break above the moving average lines, the altcoin will reach a high of $7.42.
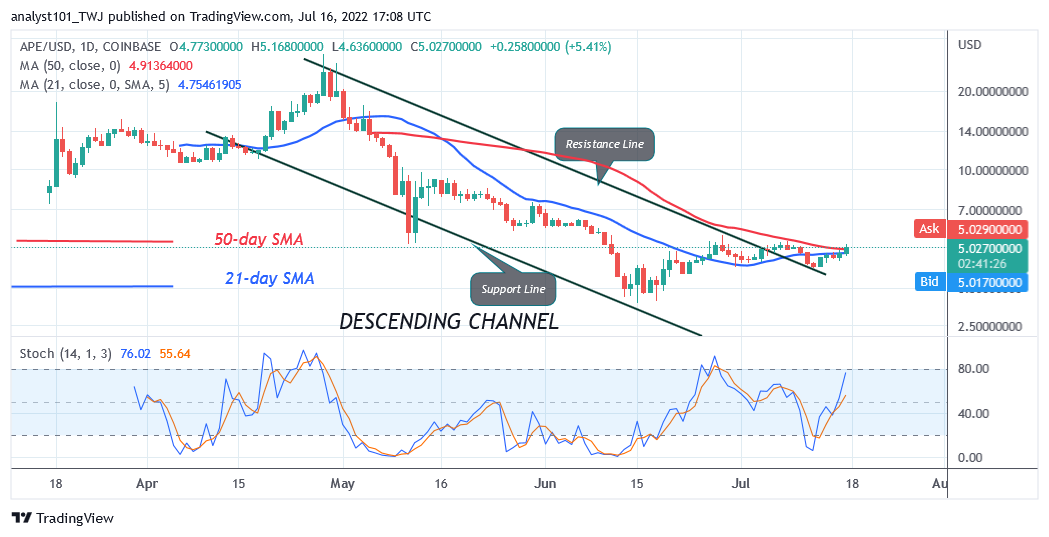
Further upward movement of the coin is doubtful as APE approaches the overbought region of the market. In the previous uptrend on June 28 and July 8, the cryptocurrency was repelled at the highs of $5.56 and $5.29 price levels. The current uptrend is likely to face rejection at the recent high. Meanwhile, the altcoin is above the 75% range of the daily stochastic. It indicates that the market is approaching the overbought region of the market. Sellers will emerge in the overbought region to push prices down.
ENJ /USD Major Trend: Bearish
Enjin Coin (ENJ) is in a downward correction as price breaks below the moving average lines. Since June 25 uptrend, the bulls have made frantic efforts to break above the 50-day line SMA. A break above the moving average lines will propel the coin to reach the highs of $0.70 and $1.20 price levels.

However, the 21-day line SMA has restrained a further upward movement of the cryptocurrency. Today, the crypto is trading at $0.50 as it faces rejection at the 21-day line SMA. On the downside, if the selling pressure persists, the market will decline to the current support at $0.44. Nonetheless, the bearish momentum will extend to the previous low at $0.37 if the bears break below the current support.


