The cryptocurrencies are trading in the bullish trend zones but the uptrend is hindered at their respective overhead resistance levels. Besides, Bitcoin and the altcoins are trading marginally because of the presence of small body indecisive candlesticks called Doji. Let us examine each of these coins.
BTC/USD Major Trend: Bullish
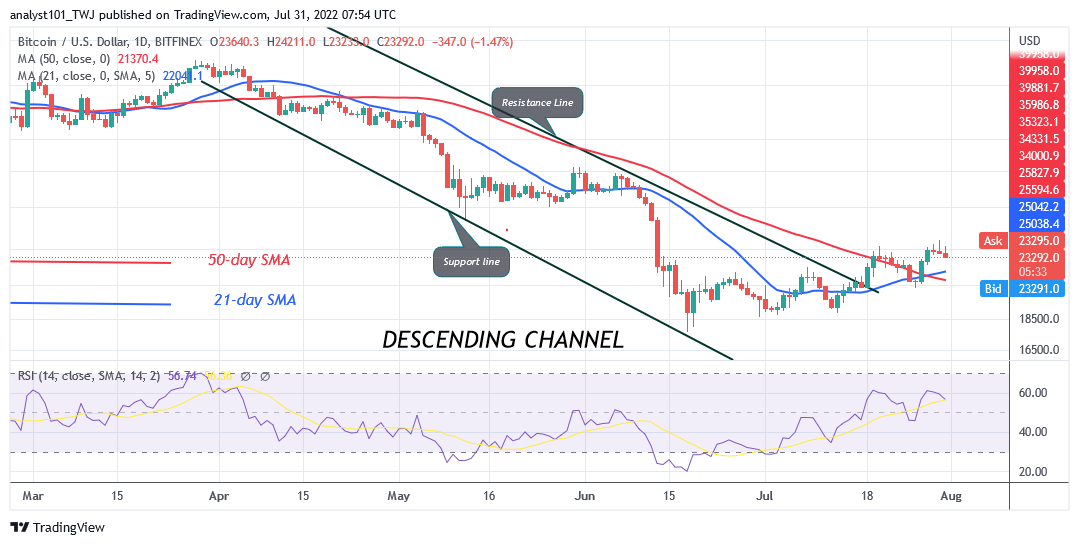
On July 30, Bitcoin’s (BTC) price rallied to the high of $24,736 but buyers could not sustain the bullish momentum above the $24,000 resistance zone. This will be the second time; Bitcoin will be repelled at the $24,000 resistance zone. The largest cryptocurrency risks decline as buyers fail to breach the recent high. On the upside, there are candlesticks with long wicks indicating that there is strong selling pressure at higher levels of price.
Further upward movement of Bitcoin is unlikely as it declines to the previous low. Nonetheless, the price action is characterized by small body indecisive candlesticks called Doji candlesticks. These indicate that Bitcoin has been compelled to a range-bound move. The crypto is likely to be range bound between $23,000 and $25,000 price levels for a few more days. BTC /USD is at level 57 of the Relative Strength Index for period 14. It indicates that Bitcoin will further resume upward.
SAND/USD Major Trend: Ranging
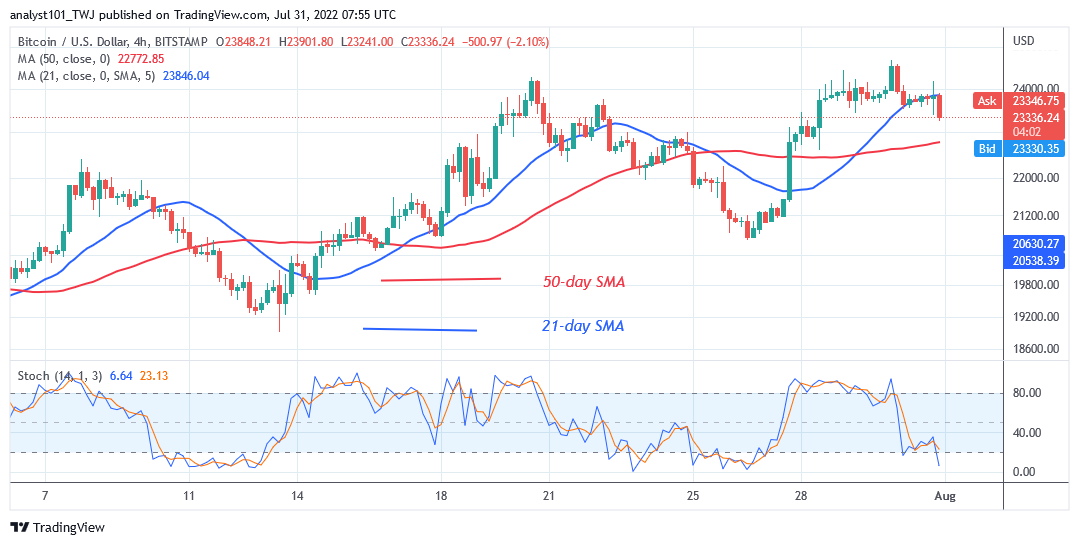
The Sandbox (SAND) price is in a sideways move. Since July 19, the cryptocurrency has been in the bullish trend zone as the price movement has remained stagnant. On the upside, the upward move has been hindered at the resistance of $1.50.
The altcoin is also trading marginally because of the presence of small body indecisive candlesticks called Doji and Spinning tops. These candlesticks indicate that buyers and sellers are undecided about the direction of the market. On the upside, the candlestick’s wick indicates strong selling pressure at higher price levels. On the downside, if the price breaks below the moving average lines, the downtrend will resume. Meanwhile, SAND is at level 54 of the Relative Strength Index for period 14. It indicates that it will further resume upward.
MANA/USD Major Trend: Bullish
Decentraland (MANA) price is trading above the moving average lines. The upward move has been hindered at the $1.10 resistance. The uptrend is doubtful as the crypto trades near the overbought region of the market.
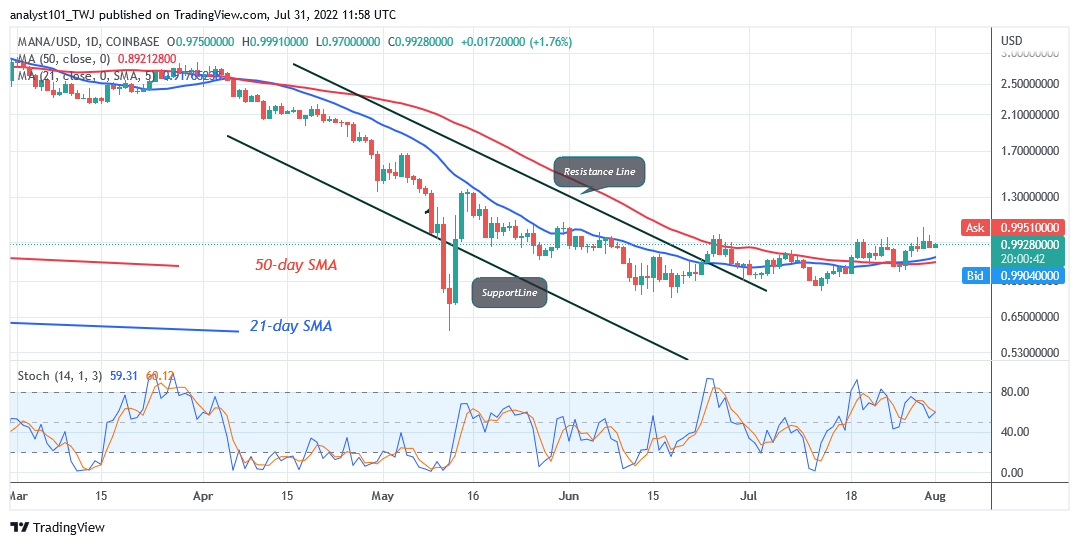
The price movement has been marginal because of the presence of small body indecisive candlesticks called Doji and Spinning tops. The upward movement will continue as long as the price bars are above the moving average lines. MANA will be in a range-bound move above the moving average lines but below the $1.10 resistance level. It is above the 60% range of the daily stochastic. It indicates that the market is in a bullish momentum.
APE /USD Major Trend: Bullish
ApeCoin’s (APE) price is trading above the moving average lines. Following its rebound above the moving averages lines on July 18, the market has been characterized by small body indecisive candlesticks called Doji. The candlesticks indicate that buyers and sellers are undecided about the direction of the market.
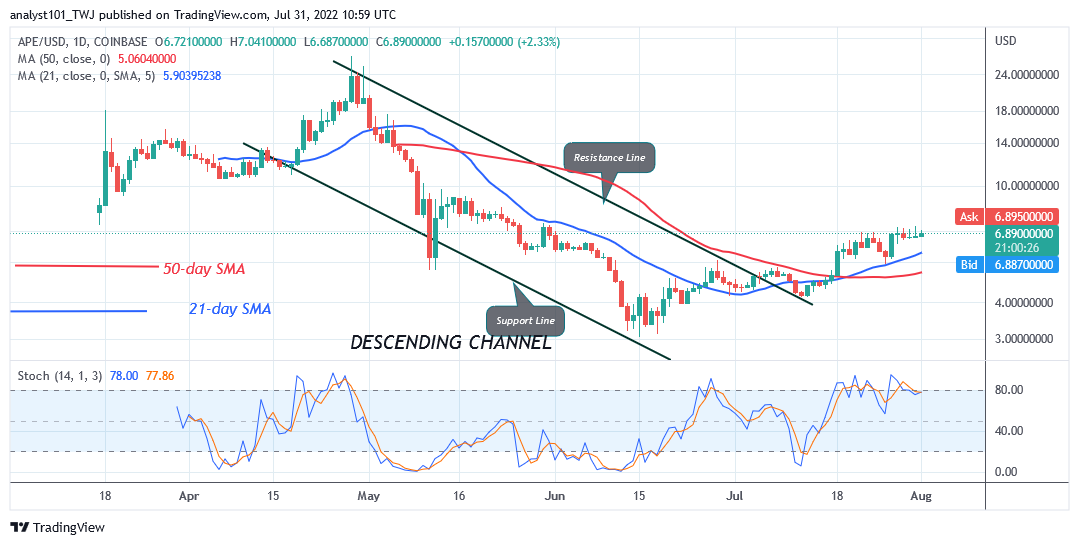
The cryptocurrency has been trading below the $7.00 resistance zone. On the upside, a break above the $7.00 resistance will catapult the altcoin to the high of $10. However, the upward move is doubtful as the altcoin trades in the overbought region of the market. Meanwhile, APE is above the 80% range of the daily stochastic. It indicates that the market has reached the overbought region. It indicates that the market is approaching the overbought region.
ENJ /USD Major Trend: Ranging
Since May 12, Enjin Coin (ENJ) has been in a range-bound move. The price bars are above the moving average lines. Since July 20, the bulls have failed to break above the $0.70 resistance level.
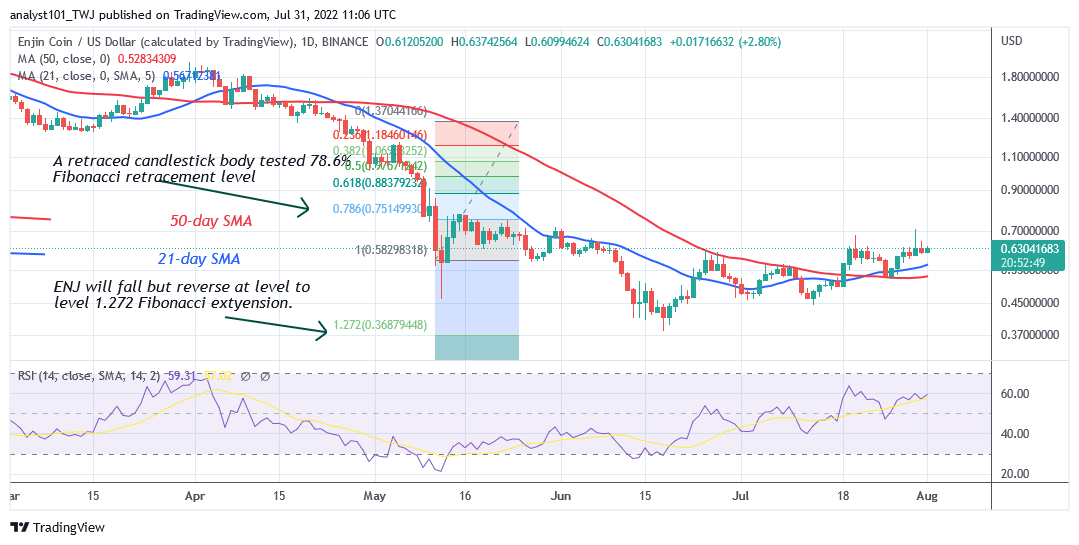
On the upside, if the bulls break the resistance at $0.70, the market will rise to level $0.90. The bullish momentum will further rise to the high of level $1.18. On the downside, the market will be compelled to a range-bound move if the bulls fail to break the recent high. It may decline and fluctuate between $0.45 and $0.70 price levels. ENJ is at level 58 of the Relative Strength Index for period 14. It indicates that it is in the bullish trend zone and may further rise.


