
Bitcoin and other cryptocurrencies have made positive moves over the past week. On September 21, Bitcoin and other cryptos declined to their previous lows and rebounded to their respective highs. BTC price has rallied above the moving average lines and buyers are attempting to sustain the bullish momentum above it.
BTC/USD Major Trend: Bearish
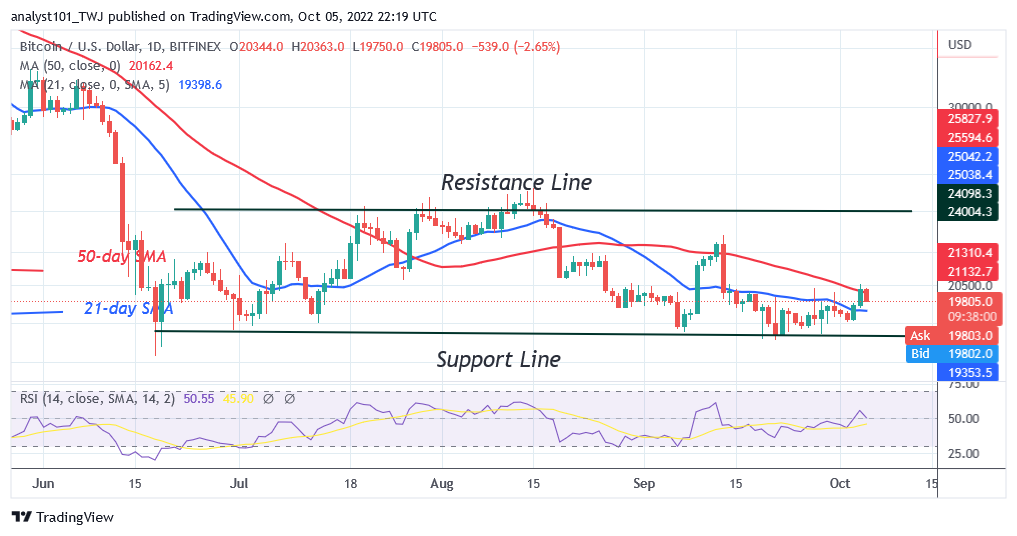
Bitcoin’s (BTC) price is declining after an upward correction to the previous highs. On October 3, the crypto’s price rebounded and rallied above the moving average lines. The rally was short-lived as Bitcoin reaches the overbought region. The largest cryptocurrency has declined below the 50-day line SMA. It may be compelled to a range-bound move between the moving average lines if it holds above the 21-day line SMA.
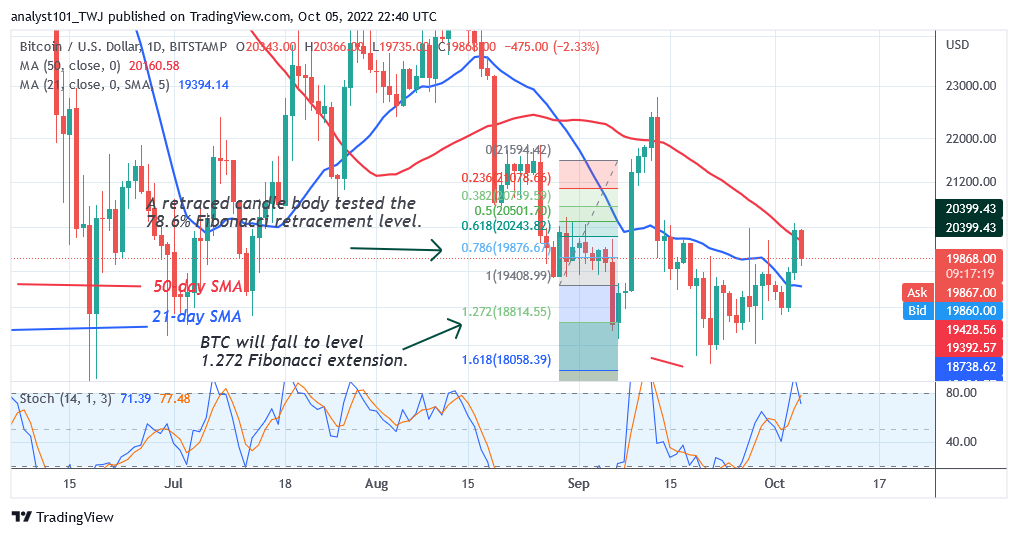
On the other hand, Bitcoin will decline and find support above $18,200 support if price breaks below the moving average lines. In the meantime, BTC’s price has been holding above the 50-day line SMA for a possible upward move. The largest cryptocurrency is capable of a further upward move at level 52 of the Relative Strength Index for period 14.
SAND/USD Major Trend: Bearish
The Sandbox (SAND) price is in a downward correction as it declines after each retest at the 21-day line SMA. Also, after each retest, the SAND price will be making a series of lower highs and lower lows.
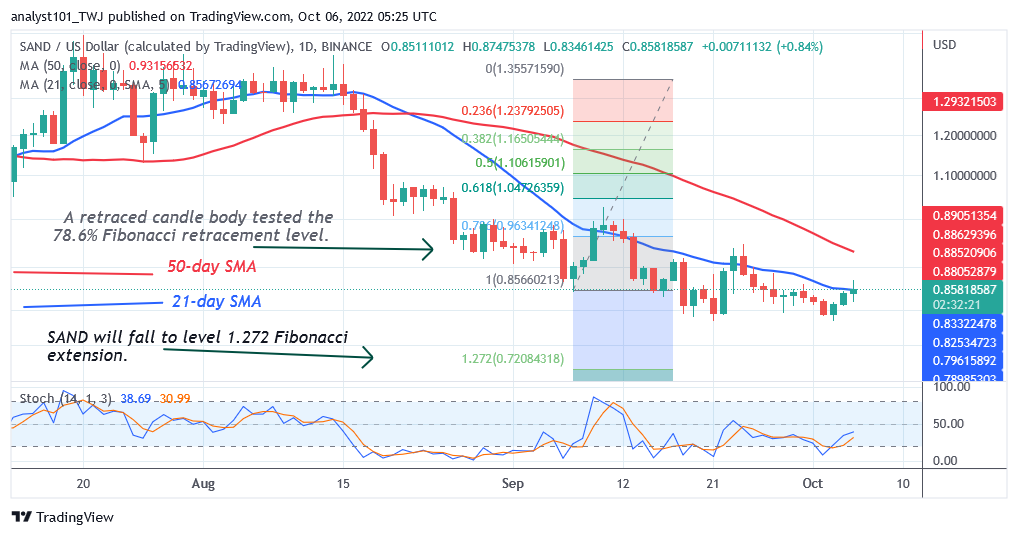
Today, buyers have pushed the altcoin to retest the 21-day line SMA as it reaches the high of $0.87. The implication is that the selling pressure will resume if the cryptocurrency turns down from the 21-day line SMA. On September 7 price slump, the SAND corrected upward and the candle body tested the 78.6% Fibonacci retracement level. The correction suggests that SAND will fall to level 1.272 Fibonacci extension or $0.72 price level. The altcoin is in a bullish momentum as it is above the 25% range of the daily Stochastic. Buyers are expected to emerge in the oversold region to push prices upward.
MANA/USD Major Trend: Bearish
Decentraland (MANA) price is in a downtrend but consolidates above the $0.66 support. On September 21, the cryptocurrency declined to its current support and attempted to rebound. However, the bullish momentum is weak as the altcoin continues its range-bound move above the current support.

Since August 19, buyers have failed to keep the price above the 21-day line SMA. The 21-day line SMA is restraining the upward moves. The altcoin will decline each time it turns down from the moving average line. On September 7 price slump, MANA made an upward correction as the candle body tested the 78.6% Fibonacci retracement level. The correction indicates that MANA will fall to level 1.272 Fibonacci extension or $0.62 price level.
APE /USD Major Trend: Bearish
ApeCoin’s (APE) price is in a downtrend but buyers are attempting to push the altcoin above the 50-day SMA. In the previous price action, buyers pushed the altcoin above the moving average lines but could not sustain the bullish momentum.
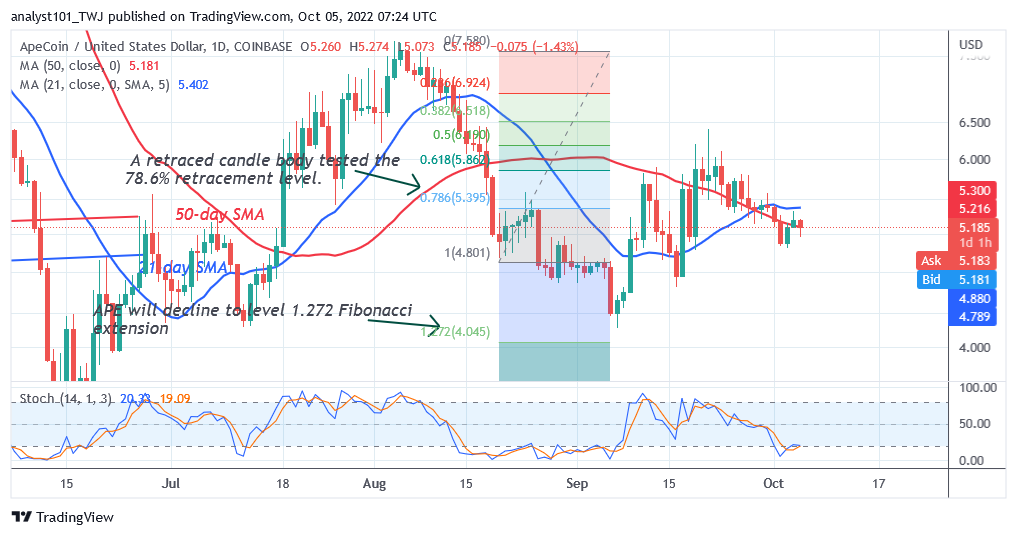
The upward moves are facing stiff rejection at the $6.00 high. The altcoin has fallen below the moving average lines. It is attempting to resume upward. A further rejection at the 21-day line SMA will cause the coin to revisit the previous low at $4.30. The cryptocurrency has fallen to the oversold region as it is below the 20% range of the daily Stochastic. Buyers will be attracted at lower levels of price.
ENJ /USD Major Trend: Bearish
Enjin Coin (ENJ) price is in a downward move and has fallen to the low of $0.43. Since August 15, the altcoin has been on a downward move. Buyers have been unable to resume the uptrend because of the resistance at the 21-day line SMA. Meanwhile, the crypto may further decline as it approaches the oversold region of the market.
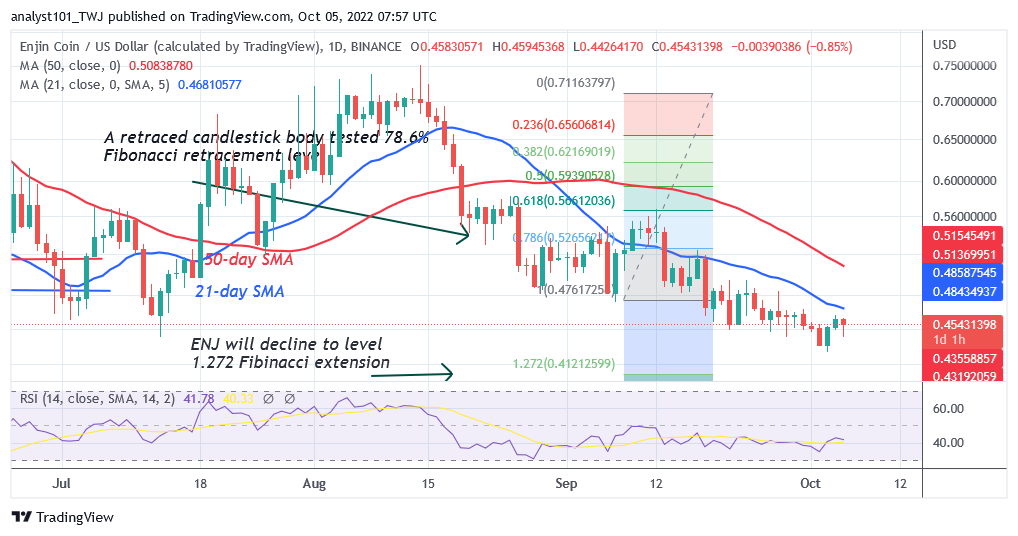
On September 8 downtrend; ENJ made an upward correction as the candle body tested the 78.6% Fibonacci retracement level. The correction indicates that ENJ will fall to level 1.272 Fibonacci extension or $0.41 price level. From the price action, ENJ has already fallen to the low of $0.43 and resumes upward. It will further decline if it turns from the moving average lines. ENJ is still in a downtrend despite the upward correction at level 42 of the Relative Strength Index for period 14.


