
Bitcoin made an upward correction to the previous highs but could not overcome the hurdle at the recent high. Buyers kept the BTC price above the moving average lines on October 23 but failed to sustain the bullish momentum.However, Bitcoin was repelled at the $19,900 resistance zone. Similarly, the altcoins made upward corrections but failed to break above the moving average lines. This week, Bitcoin and the altcoins may risk further decline.
BTC/USD Major Trend: Bearish
Bitcoin (BTC) is in a sideways move but it is confined in a range. Following an unsuccessful attempt to break above the moving average lines, Bitcoin has resumed selling pressure.
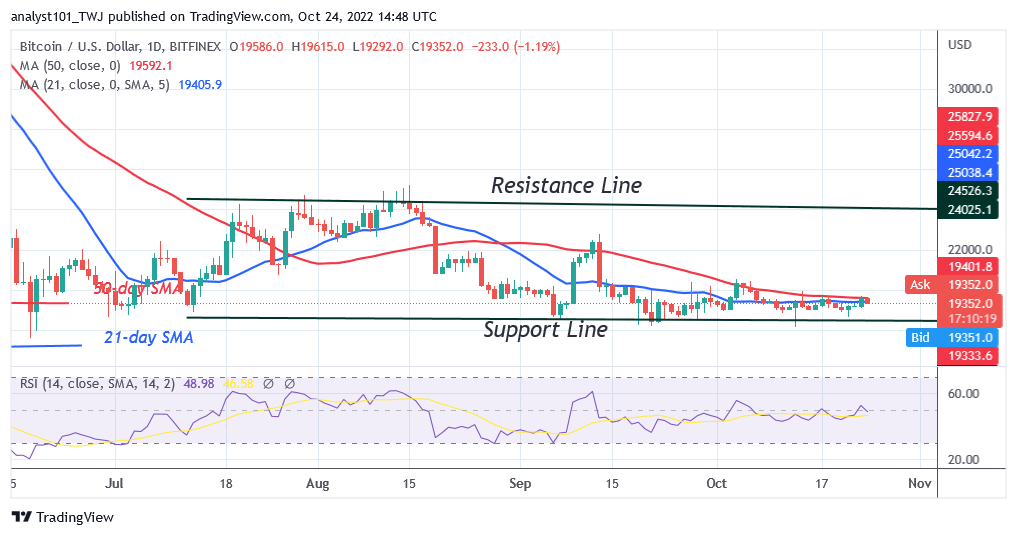
On October 23, buyers pushed the BTC price above the moving average lines. The cryptocurrency got stuck at $19,707 or the 50-day line SMA. The upward move was hindered as the BTC price reached the overbought region. Buyers were having some difficulty at recent highs as sellers emerge. On the upside, if buyers had overcome the resistance at $19,707, Bitcoin could have increased to $20.400. Today, the BTC price has retraced between the moving average lines. The selling pressure will resume if the 21-day line SMA is breached.
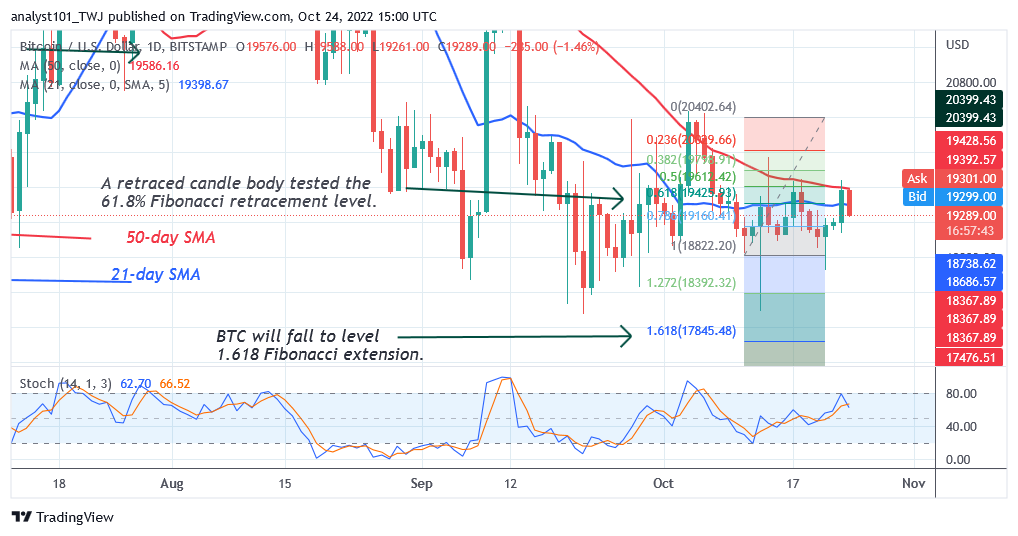
The largest cryptocurrency will decline to the range-bound zone between $18,800 and $19,900 if the 21-day line SMA is breached. According to the price indicator, Bitcoin risks further decline. On October 11 price slump, BTC made an upward correction and a candle body tested the 61.8% Fibonacci retracement level. The correction indicates that BTC will fall to level 1.618 Fibonacci extension or $17,845.48.
SAND/USD Major Trend: Bearish
The Sandbox (SAND) price is in a downtrend but it is making an upward correction to retest the 21-day line SMA. Since August, the crypto’s price has been making a series of lower highs and lower lows.
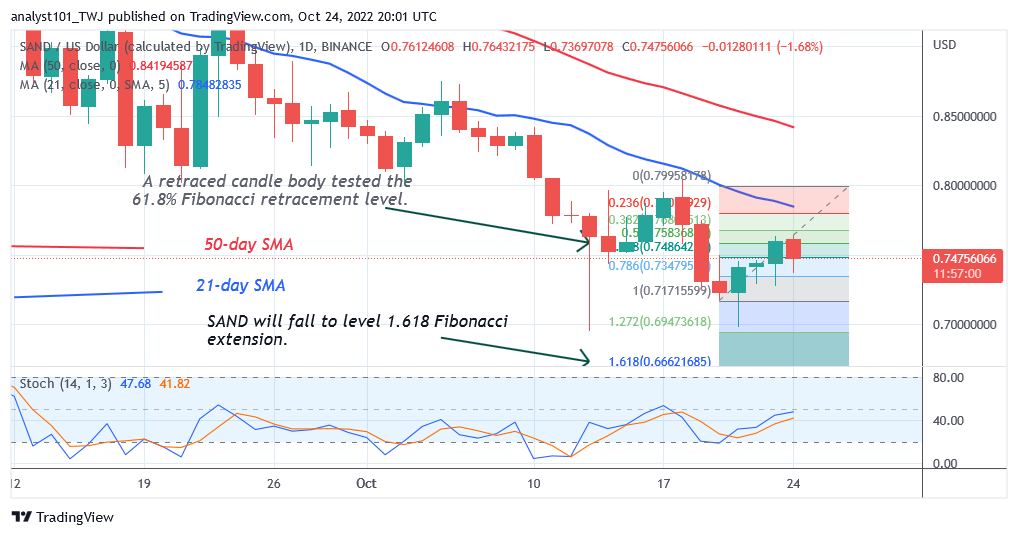
Buyers have failed to break above the 21-day line SMA which acted as a resistance to the price bars. The altcoin will decline if it faces rejection at the recent high. On October 20 downtrend, SAND made an upward correction and a candle body tested the 61.8% Fibonacci retracement level. The correction implies that SAND will fall to level 1.618 Fibonacci extension or level $0.66. SAND is in a bullish momentum above the 40% range of the daily Stochastic.
MANA/USD Major Trend: Bearish
Decentraland (MANA) price is in a downtrend and has fallen significantly to the bottom of the chart. The cryptocurrency has fallen and revisited the historical price level of October 25, 2021.
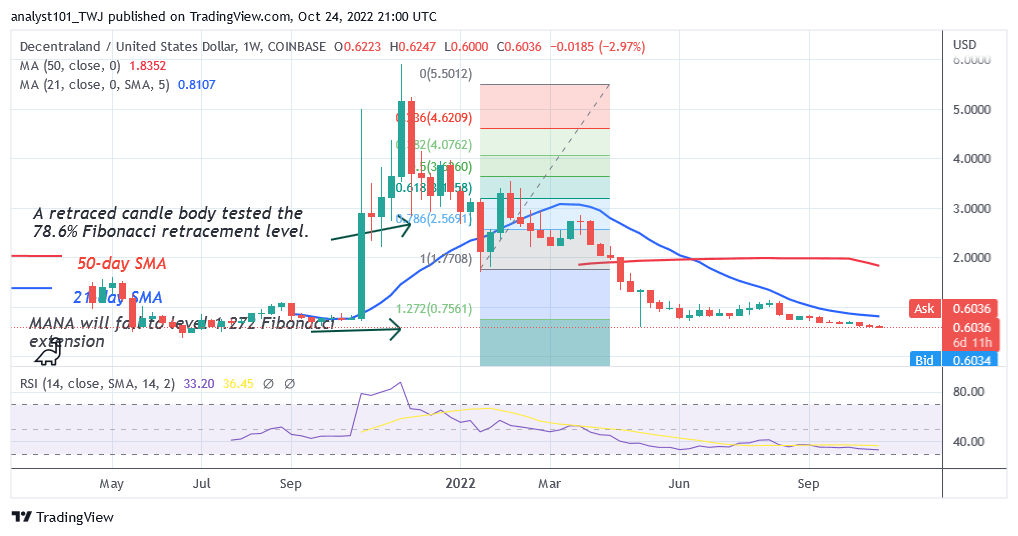
On a weekly chart, MANA corrected upward and a candle body tested the 78.6% Fibonacci retracement level on January 2022. The correction indicates that MANA will fall to level 1.272 Fibonacci extension or $0.75. From the price action, MANA has fallen to the low of $0.60. The coin has fallen to level 33 of the Relative Strength Index for period 14. The altcoin is approaching the oversold region of the market.
APE /USD Major Trend: Bearish
ApeCoin’s (APE) price is in a downtrend but it is making an upward correction.
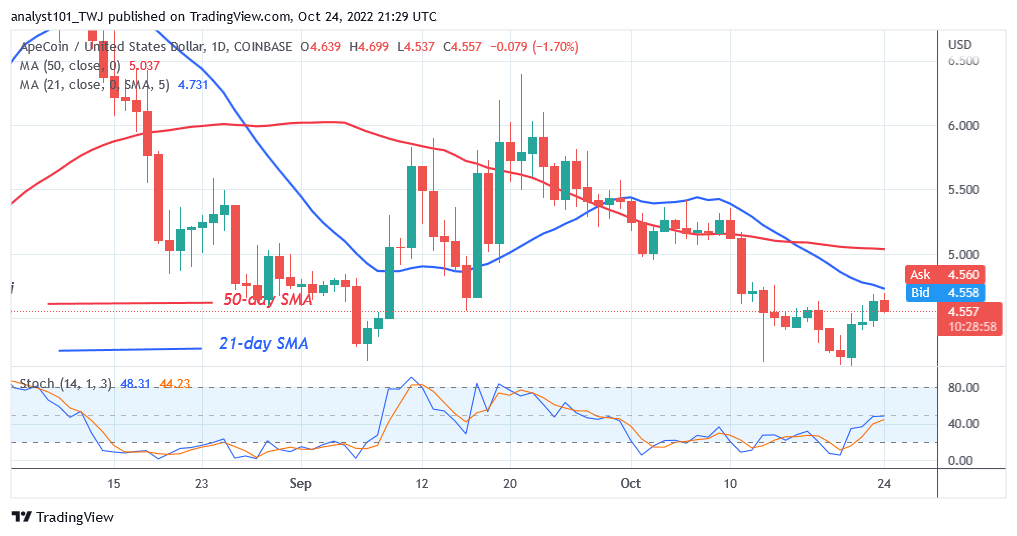
The uptrend is facing rejection at the 21 –day line SMA. The coin will rise above the moving average line and retest the previous high of $6.00. However, the altcoin will decline to the current support at $4.13 if it turns down from the moving average lines. The current support has been holding since July. APE has resumed an upward move and it is above the 30% range of the daily stochastic.
ENJ /USD Major Trend: Bearish
Enjin Coin (ENJ) is in a downtrend as the altcoin retest and fluctuates below the moving average lines. Since the August 28 price slump, buyers have failed to regain bullish momentum above the moving average lines.

The upward moves are being repelled at the 21-day line SMA. On the August 28 downtrend, ENJ corrected upward and a candle body tested the 50% Fibonacci retracement level. The correction implies that ENJ will fall to level 2.0 Fibonacci extension or $0.39. From the price action, the market has declined to the low of $0.40 at the time of writing. Enjin Coin is in the downtrend zone at level 34 of the Relative Strength Index for period 14.


