
Bitcoin and the altcoins have unique price movements as buyers pushed the cryptos above the moving average lines. However, the cryptos faced stiff resistance at their respective highs. Nevertheless, the altcoins may be compelled to a range-bound move as the coins retrace between the moving average lines.
BTC/USD Major Trend: Bullish
Bitcoin (BTC) is in an uptrend after a price rebound on October 25. The largest cryptocurrency rallied to the high of $21,022 but was resisted. The bullish momentum could not be sustained as Bitcoin reached an overbought region.
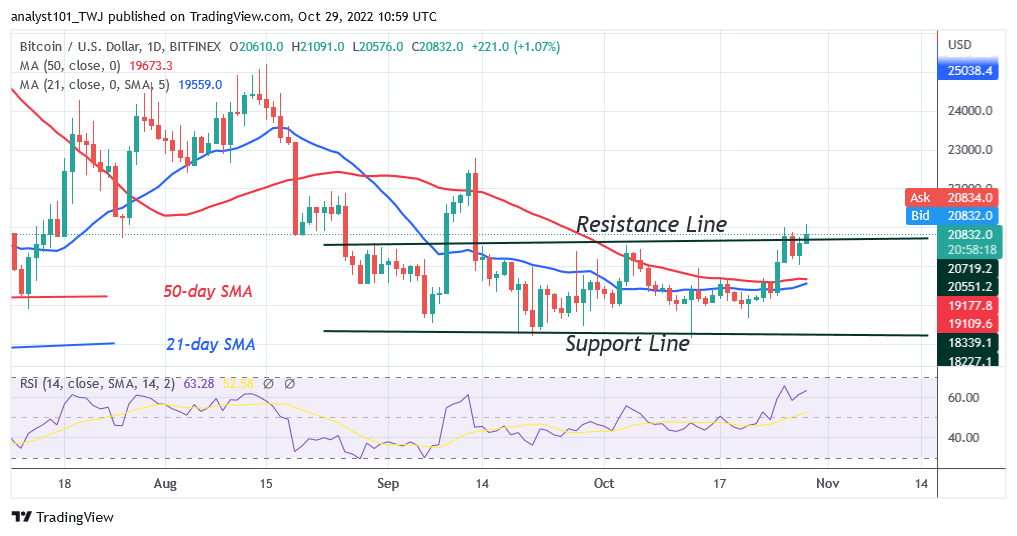
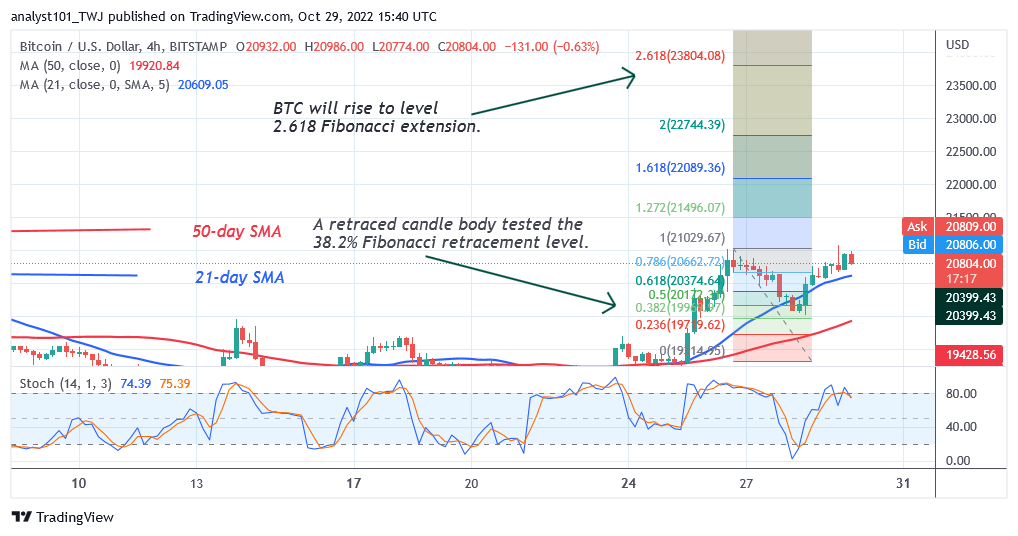
For the past four days, BTC price has been struggling to break the recent high. On October 29, buyers retested the resistance level and were repelled. Further upward move is doubtful as the market reaches the overbought region. However, if buyers overcome the resistance at $21,022, the market will rally above the $22,000 high. In addition, if the bullish momentum extends and breaches the resistance at $22,794, Bitcoin will rally to $25,205. Conversely, if buyers failed to breach the $21,022 resistance, Bitcoin will resume selling pressure.
The largest cryptocurrency will decline above the $20,000 psychological price level. Bitcoin may decline to the range-bound zone between $18,800 and $19,900 price levels if the $20,000 support is breached. BTC/USD is trading at $20,690 at the time of writing.
SAND/USD Major Trend: Bullish
The Sandbox (SAND) price is in an upward correction as it breaks above the moving average lines. The altcoin rallied to the high of $0.94 and pulled back.
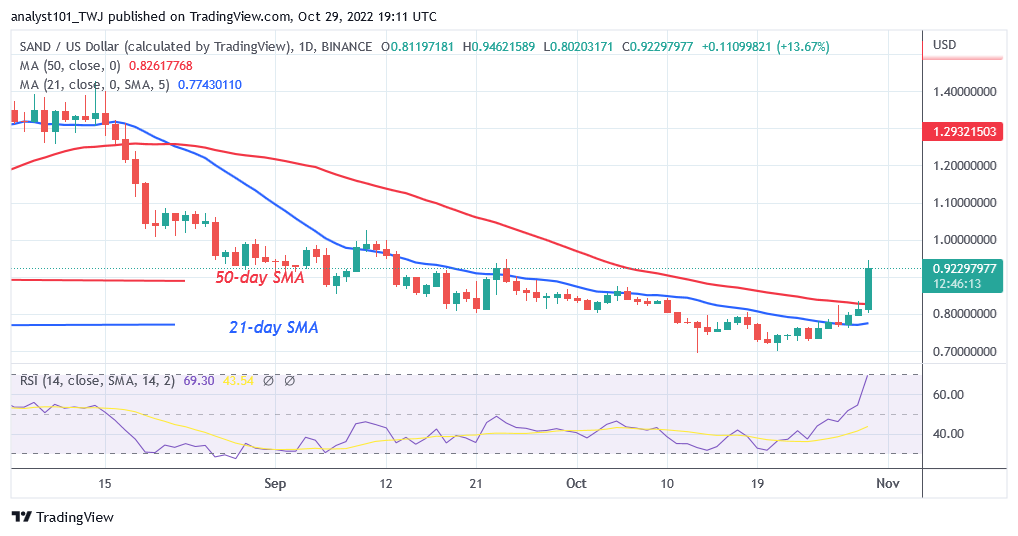
The Sandbox is capable of reaching the previous high of $1.40 but risks a decline. Further upward movement of price is doubtful as the market reaches the overbought region. Meanwhile, the cryptocurrency is in the bullish trend zone at level 67 of the Relative Strength Index for period 14. The altcoin will be overbought at level 70 of the RSI.
MANA/USD Major Trend: Bullish
Decentraland (MANA) price is in an upward correction as it breaks above the moving average lines. The coin reached the high of $0.73 and pulled back.
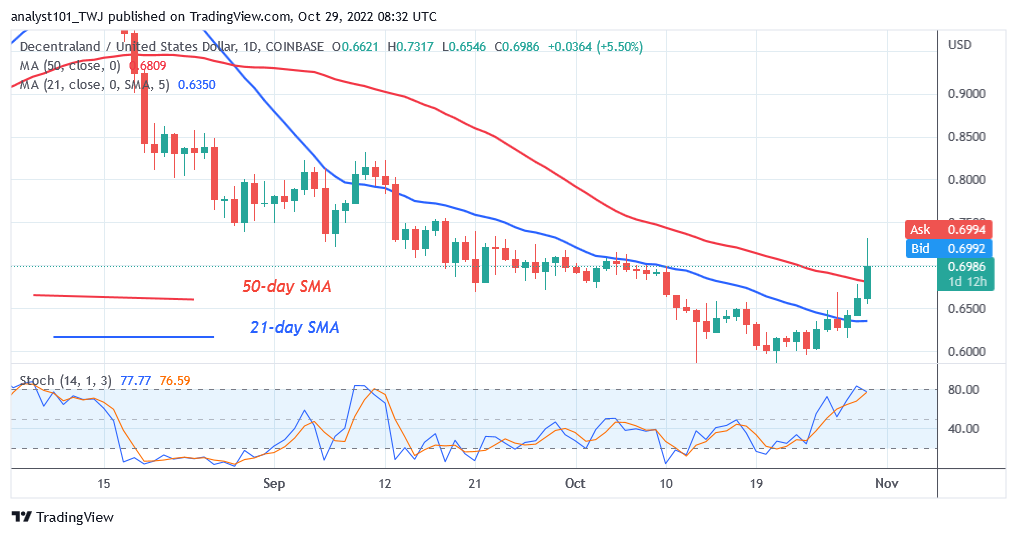
The cryptocurrency will be compelled to a range-bound move if it retraces below the 50-day line SMA. In the same vein, the bullish momentum will resume if the 50-day line SMA support holds. MANA is in the overbought region above the 80% range of the daily Stochastic. MANA may decline as it reaches the overbought region.
APE /USD Major Trend: Bullish
ApeCoin’s (APE) price is in an upward correction but it is confined between the moving average lines. The upward move may resume if price breaks above the 50-day line SMA.
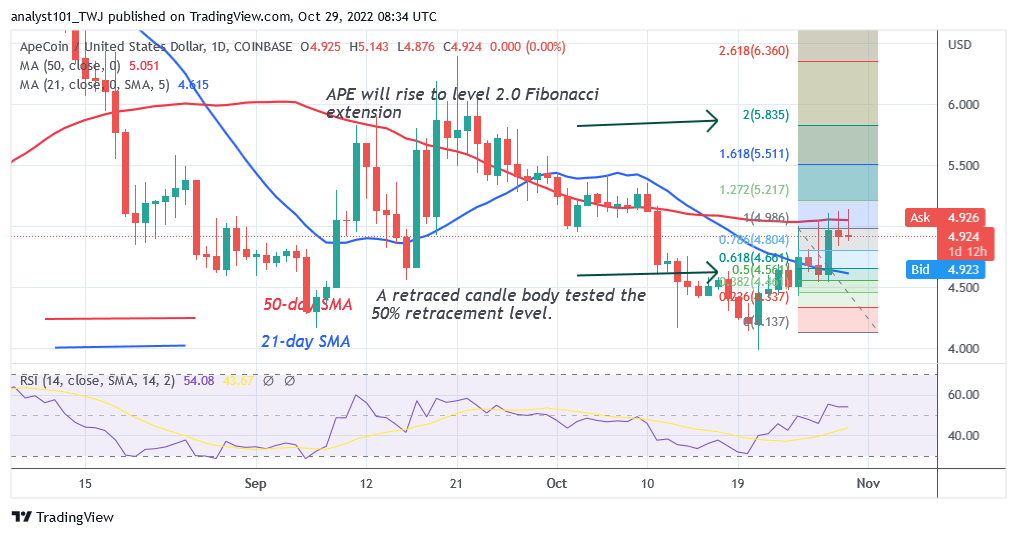
On October 25 uptrend, a retraced candle body tested the 50% retracement level. The retracement suggests that APE will rise to level 2.0 Fibonacci extension or $5.83. The altcoin is between the moving average lines indicating a possible range-bound move of the cryptocurrency. APE is in the uptrend zone at level 52 of the Relative Strength Index for period 14.
ENJ /USD Major Trend: Bullish
Enjin Coin (ENJ) is in an upward correction as it breaks above the moving average lines. According to the price indicator, the current downtrend has reached bearish exhaustion.
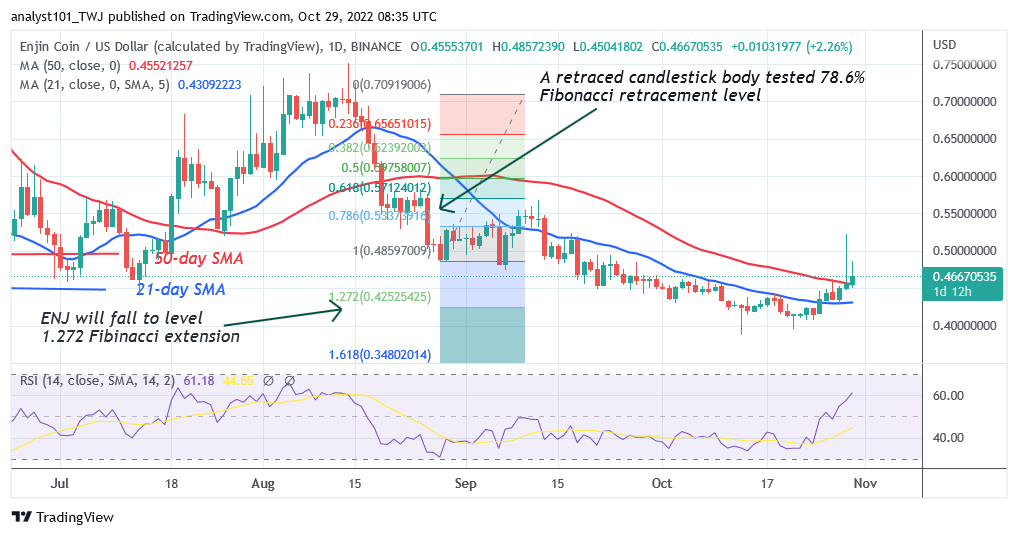
On the August 28 downtrend, ENJ made an upward correction and a candle body tested the 78.6% Fibonacci retracement level. According to the correction, ENJ will drop or reverse at level 1.272 Fibonacci extension, or $0.42. On October 29, the bulls broke above the moving average lines and reached a high of $0.52. However, ENJ declined sharply to the low of $0.44.The upward correction is facing stiff rejection at the $0.50 high. ENJ/USD will be compelled to a range bound if it retraces below the 50-day line SMA. The coin is in the uptrend zone at level 57 of the Relative Strength Index for period 14.


