
Bitcoin is yet to recover from the current downtrend as it is stuck below the $50,000 psychological price level. The king coin is consolidating in a tight range that will result in a price rebound or breakdown. Nonetheless, Ripple and other altcoins are still in downward correction as they attempt to break into the bullish trend zones.
BTC/USD Major Trend: Bearish
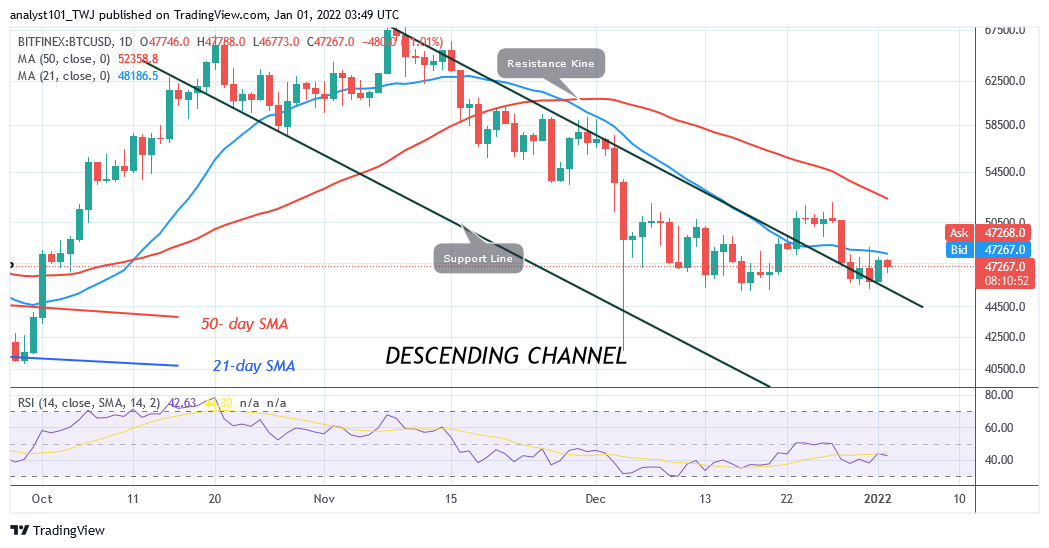
Bitcoin’s (BTC) price is in a downward correction as price breaks below the moving averages. The cryptocurrency risks further decline as it fluctuates in the bearish trend zone. After the December 4 price slump, the bearish trend of Bitcoin subsided. The cryptocurrency plunged to $41, 634 low as bulls bought the dips. BTC price corrected upward to reach the high of $52,000 and commenced a range-bound move. For the past month, BTC/USD has been a range-bound move between $46,000 and $52,000 price levels.
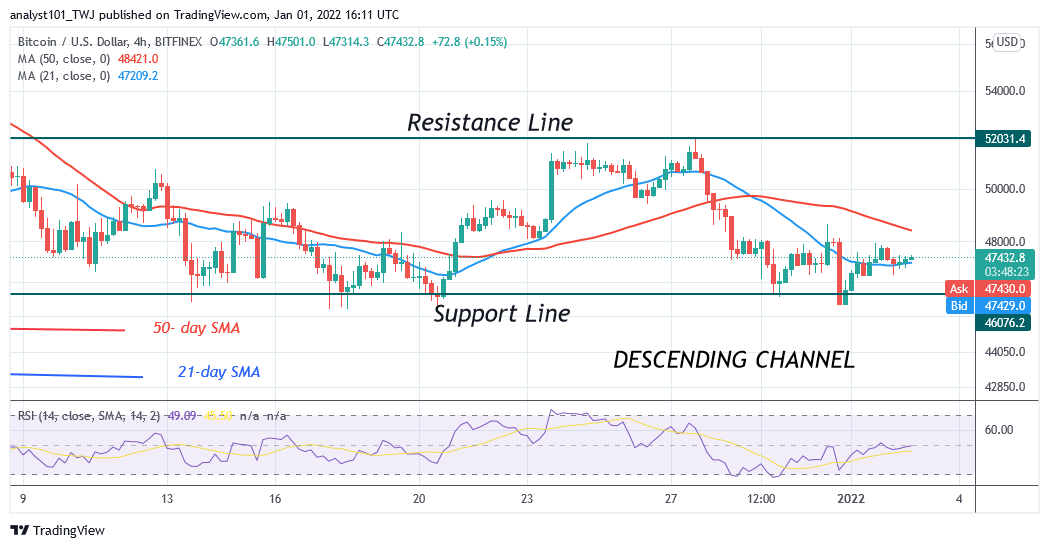
Nonetheless, for the past five days, the king coin is trading in a tight range between $46,000 and $48,000. Bitcoin’s upward move has been restricted below the $50,000 price level. In a tight range, BTC prices may be faced with a price rebound or breakdown. On the upside, if Bitcoin rebounds above the current support, it will break the resistance at $48,000 and rally above $52,000 high. The bullish momentum will extend to the high of $55,000. Similarly, if the bears break below the $46,000 support, Bitcoin will further decline to $41,634 low.
XRP/USD Major Trend: Bearish
Ripple’s (XRP) price is still in a downward correction as the cryptocurrency fall below the moving averages. On December 23 uptrend, XRP recovered from the bearish trend as price broke the 21-day line moving average and retested the 50-day line moving average. On December 23, buyers failed to breach the resistance at $1.00.
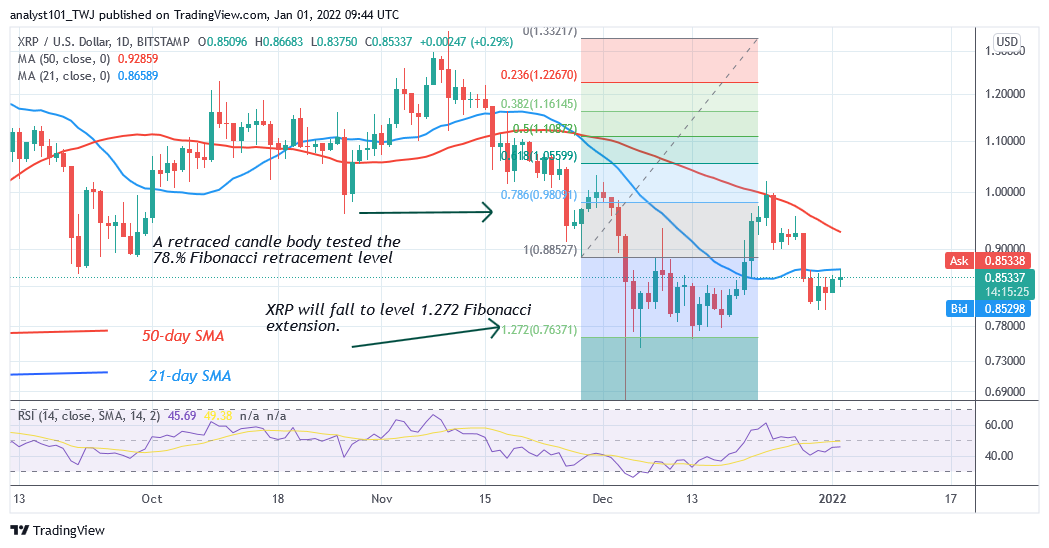
Also, buyers fail to break above the 50-day line moving average. Consequently, the bearish trend resumed as XRP price fell below the moving averages. From the Fibonacci tool analysis, Ripple has reversed from the downtrend at the $0.76 price level. On November 28 downtrend; a retraced candle body tested the 78.6% Fibonacci retracement level. The retracement indicates that XRP price will fall to level 1.272 Fibonacci extension or $0.76. Today, there are bullish candlesticks as buyers attempt to push XRP upward.
DOT/USD Major Trend: Bearish
Polkadot’s (DOT) price is still in a downward correction. On January 1, the bulls broke above the 21-day line moving average and resumed upward. This will be the second time, buyers will be pushing DOT price to the previous highs.
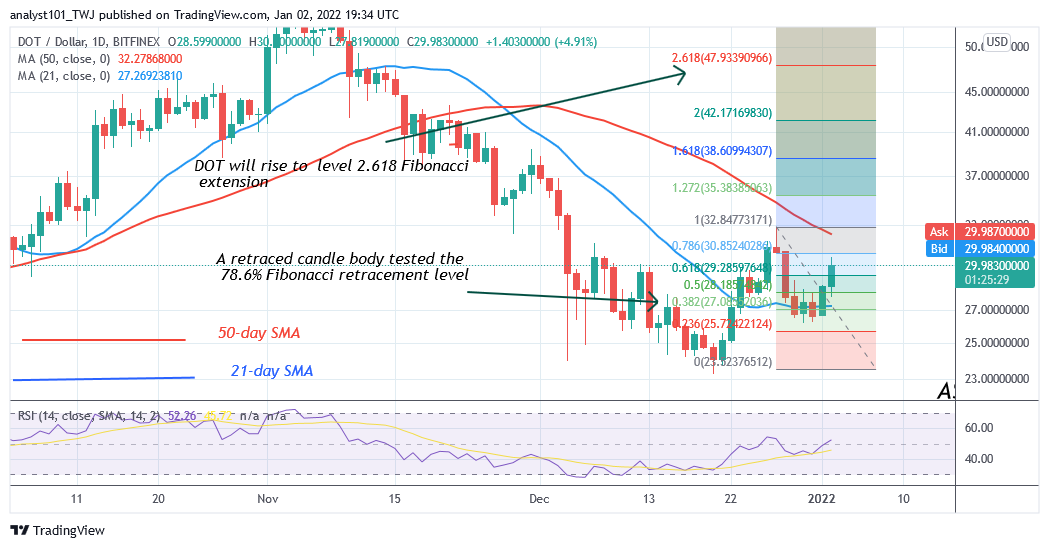
In the first attempt, buyers pushed the altcoin to the high of $32 but were repelled. DOT price slumped to $26 low and resumed upward. Polkadot has reached the high of $30 at press time. On the upside, if buyers breach the resistance at $32, the market will rally to $48. Meanwhile, on December 27 uptrend; a retraced candle body tested the 38.2% Fibonacci retracement level. The retracement indicates that the DOT price will rise to level 2.618 Fibonacci extension or $47.93.
LTC /USD Major Trend: Bearish
On the daily chart, Litecoin’s (LTC) price is in a downward correction as price breaks below the moving averages. Today, buyers are struggling to break above the 21-day line moving averages. Litecoin will be out of downward correction if price breaks above the $200 high.
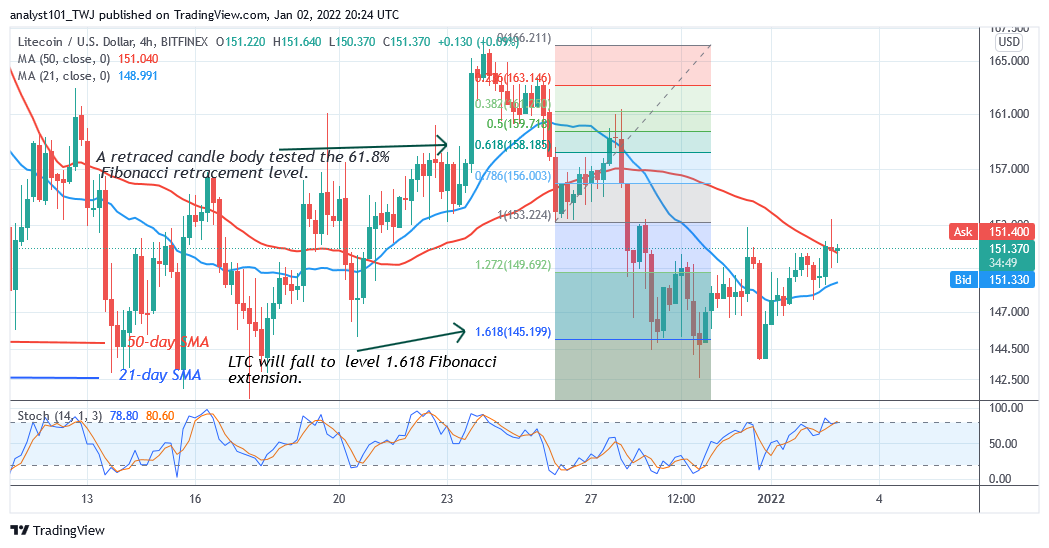
On the 4-hour chart, Litecoin has recovered from the current downtrend after retesting the current support at $144 on three occasions. Buyers have pushed the altcoin as price breaks above the moving averages but faced rejection at the 50-day line moving averages. Meanwhile, on December 26 downtrend; a retraced candle body tested the 61.8% Fibonacci retracement level. The retracement suggests that LTC price will fall to level 1.618 Fibonacci extensions or $145.19. From the price action, the market has reached the overbought region. Perhaps, Litecoin will retrace to the low of $148 before an upward resumption.
LINK /USD Major Trend: Bearish
Chainlink’s (LINK) price is in a downward correction as price breaks above the 21-day line moving average but fails to break above the 50-day line moving average. Chainlink will be out of downward correction if price breaks above the 50-day line moving average.
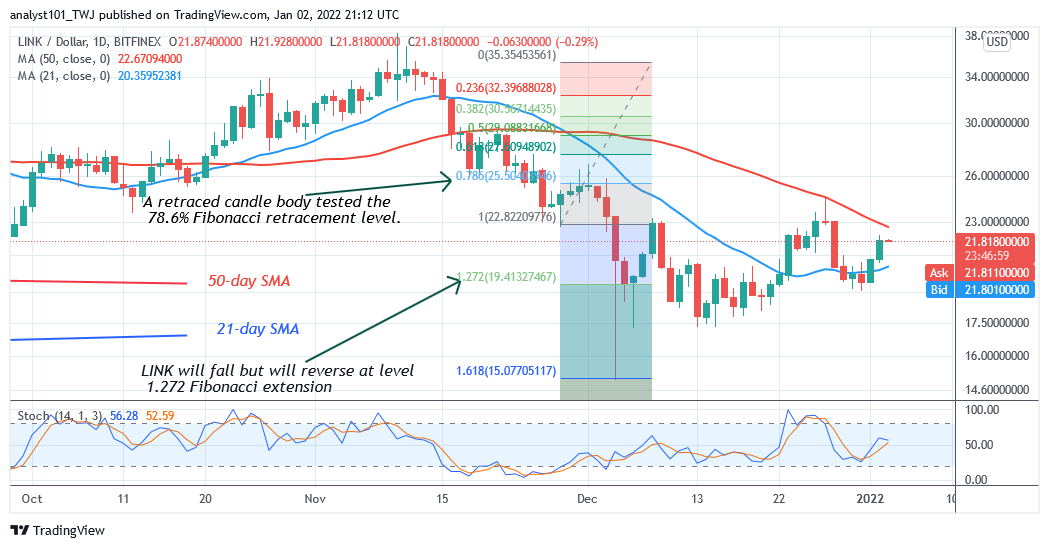
In other words, the bulls will have to keep the price above the $26 high to commence upside momentum. In the meantime, Chainlink has reversed from the current downtrend. According to the Fibonacci tool, on November 28 downtrend; a retraced candle body tested the 78.6% Fibonacci retracement level. The retracement suggests that LINK will fall to level 1.272 Fibonacci extension or $19.41 high. From the price action, the market is above the Fibonacci extension as it resumes upward.


