
Bitcoin is revisiting the $20, 0000 psychological price level after rejection at the $22,425 high. This indicates the presence of sellers at higher price levels. Simultaneously, SAND, APE, MANA, and ENJ are falling as a result of the decline. The implication is that if Bitcoin starts a new rally, it will positively affect the rise of the other cryptocurrencies.
BTC/USD Major Trend: Bearish
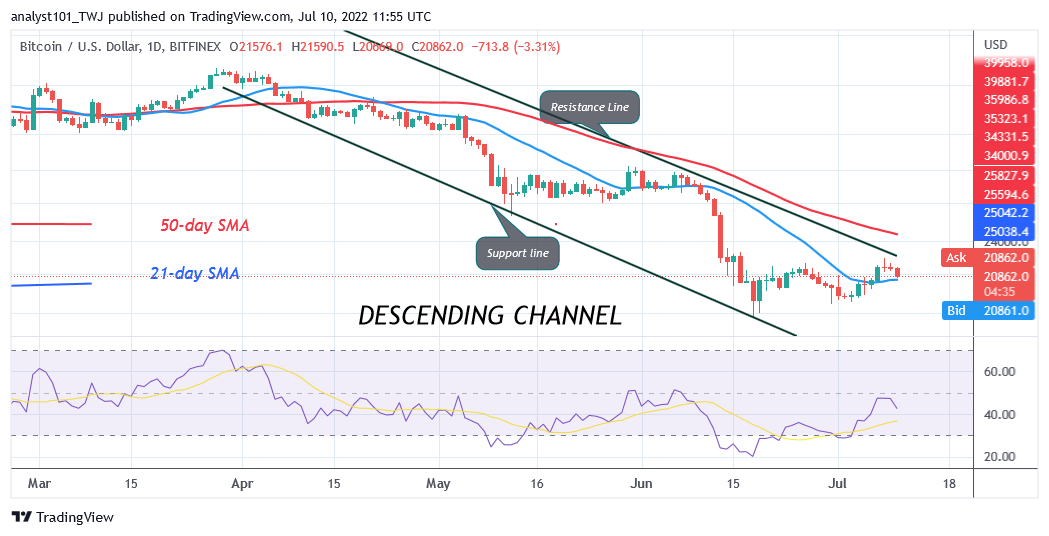
Bitcoin’s (BTC) price is in an upward correction as price breaks the 21-day line SMA to reach the high of $22,425. The bulls could not sustain the bullish momentum after breaking the initial resistance at $21,675. On the upside, if the bullish momentum had extended and broken above the $23,010 resistance, Bitcoin could have rallied to the high of $30,000. On July 8, the upward correction was terminated as the BTC price declined to the previous lows. On the downside, if BTC price retraces and breaks below the 21-day line SMA, Bitcoin will decline and struggle to hold above the $20,000 support.
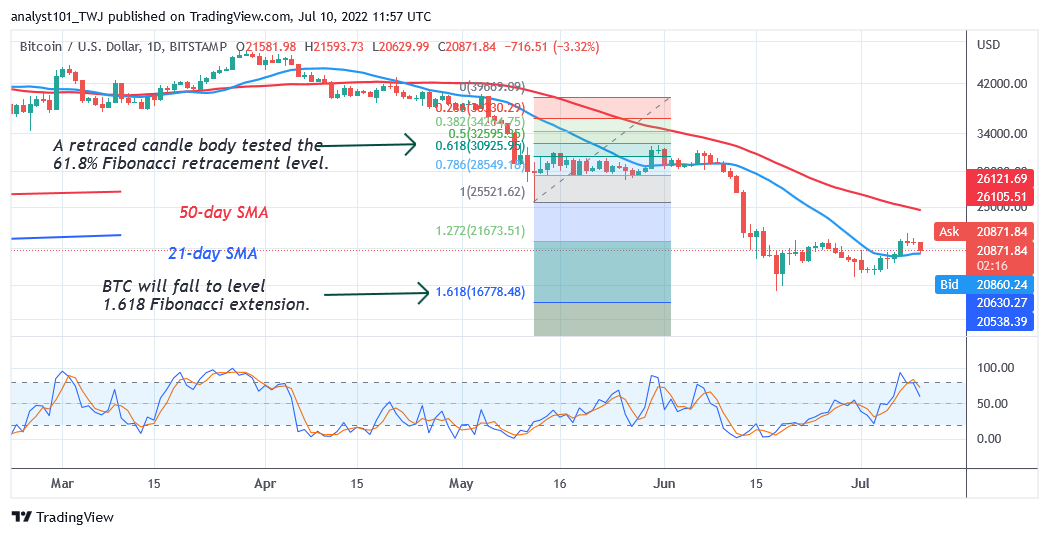
On the other hand, if the BTC price holds above the 21-day line SMA, BTC /USD will be compelled to a range-bound move between the moving average lines. Meanwhile, Bitcoin is at level 29 of the Relative Strength Index for period 14. It indicates that the crypto has fallen to the oversold region of the market. Bitcoin is trading at $20,776 at the time of writing.
SAND/USD Major Trend: Bearish
The Sandbox (SAND) price is in a downward correction but the bears are attempting to break below the moving average lines. In the previous price action, the bulls broke above the moving average lines to reach the high of $1.33. The upward moves could not be sustained after reaching the high of $1.33.
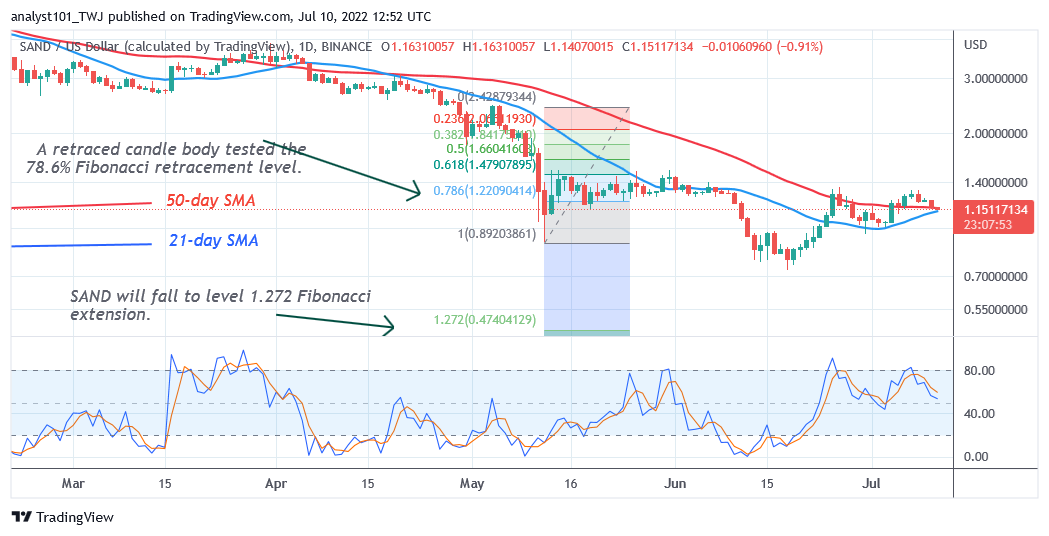
Buyers made frantic efforts to break the recent high after retesting it twice. Sellers emerged at the recent rally as the coin declined. On the downside, if the bears break below the moving average lines, the altcoin will decline to the previous at $0.90. On the other hand, the SAND may resume a fresh uptrend if the altcoin holds above the 21-day line SMA.
MANA/USD Major Trend: Bearish
Decentraland (MANA) price has broken below the moving average lines indicating a possible downward move of the coin. The altcoin may decline to the low of $0.72 or the previous low of $0.59.
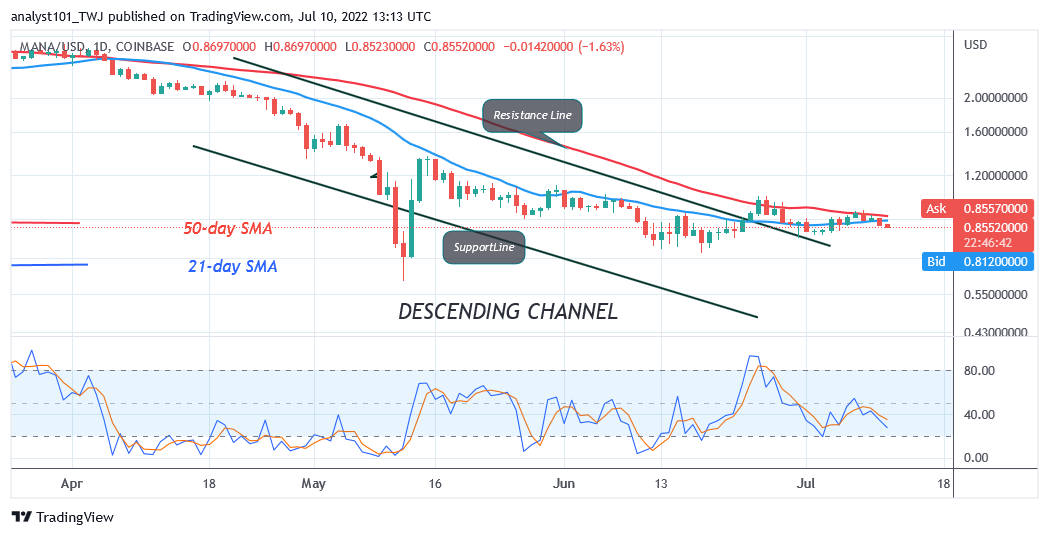
Nevertheless, the price movement has been doubtful because of the presence of small indecisive candlesticks called Doji. The Doji Candlesticks indicate that buyers and sellers are undecided about the direction of the market. The altcoin is below the 40% range of the daily stochastic. It indicates that the coin is in a bearish momentum.
APE /USD Major Trend: Bearish
ApeCoin’s (Ape) price has been in a downward correction after the June 13 price slump. On June 27, the bulls broke above the 21-day line SMA but failed to break the 50-day line SMA. For the past two weeks, ApeCoin has been trading between the moving average lines.
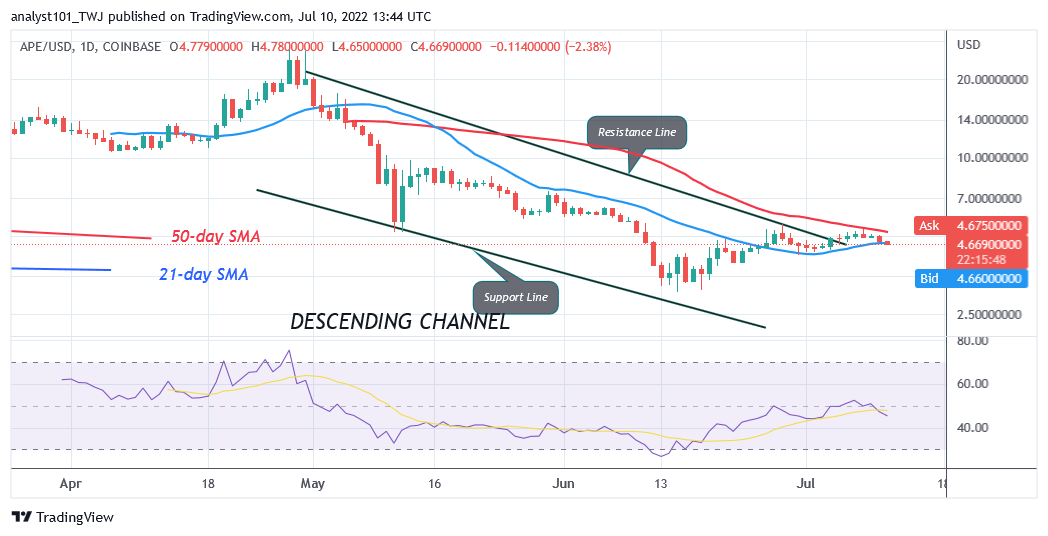
The market will rise to reach the previous high of $7.47 if the bulls break above the 50-day line SMA. On the other, the selling pressure will resume if the bears break below the 21-day line SMA. Today, the bears are breaking below the 21-day line SMA. That is, the coin will decline and revisit the previous low at $3.20. However, the price movement is doubtful because of the presence of small body indecisive candlesticks called Doji. The coin is at level 45 of the Relative Strength Index for period 14. It indicates that it is in the downtrend zone and capable of further decline.
ENJ /USD Major Trend: Bearish
Enjin Coin (ENJ) has been trading between the moving average lines since June 25. The bears have broken below the 21-day line SMA. This indicates that the coin will decline to the low above $0.37.
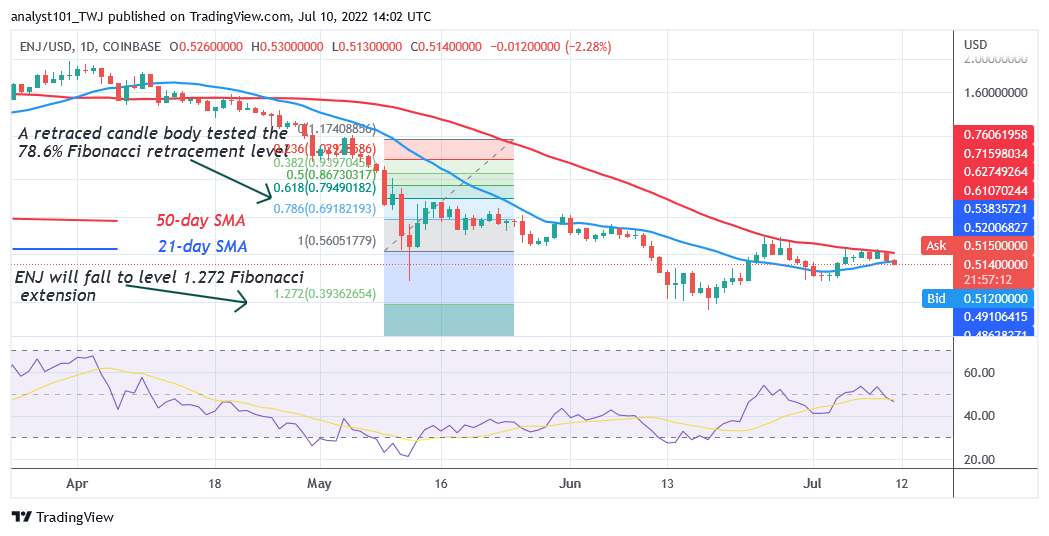
However, the price movement has been slow because of the presence of small body indecisive candlesticks called Doji. The current downtrend has subsided as the cryptocurrency fell to the low of $0.46 on May 12. The coin is at level 47 of the Relative Strength Index for period 14. It indicates that the cryptocurrency is in the downtrend zone and capable of a further decline.


