
Bitcoin and the other cryptos have fallen below the moving averages indicating that the bears are still in control. The bulls broke above the 21-day line SMA but face selling pressure at the recent highs. The market is declining to the current support. However, if the current support is breached, the downtrend is likely to resume. Let us examine each of these coins.
BTC/USD Major Trend: Bearish
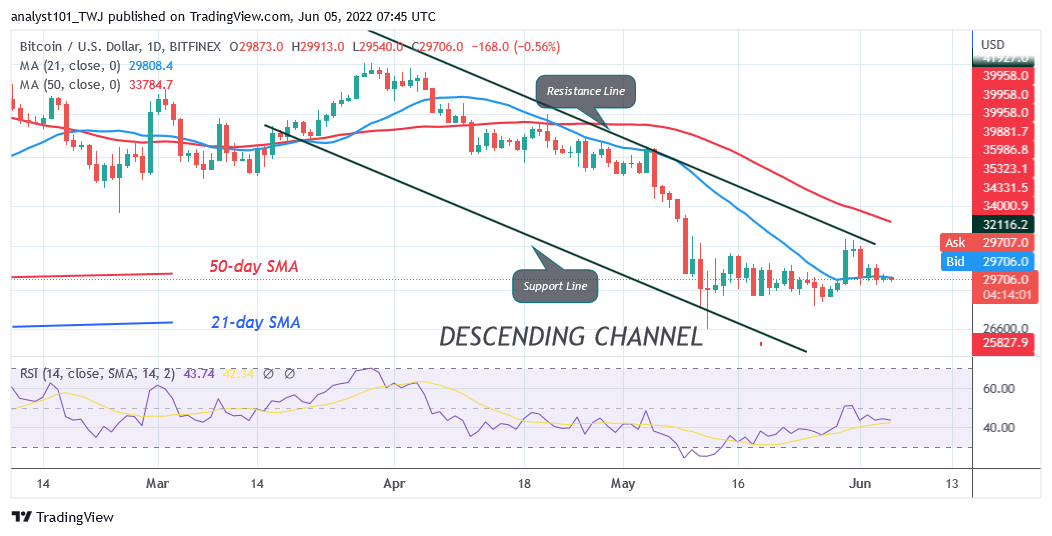
Bitcoin’s (BTC) price is in a downward correction as it broke above the 21-day line moving average. On May 30, the bulls broke above the 21-day line SMA but failed to break the 50-day line SMA. It faced rejection at the recent high but found support above the 21-day SMA. From every indication, BTC/USD is likely to be range-bound move between the moving averages. The cryptocurrency will trend when the range-bound levels are broken. For instance, on May 31, Bitcoin rallied to the high of $32,407 but was resisted. BTC price could have risen above the 50-day line SMA or to the $40,000 psychological price level.
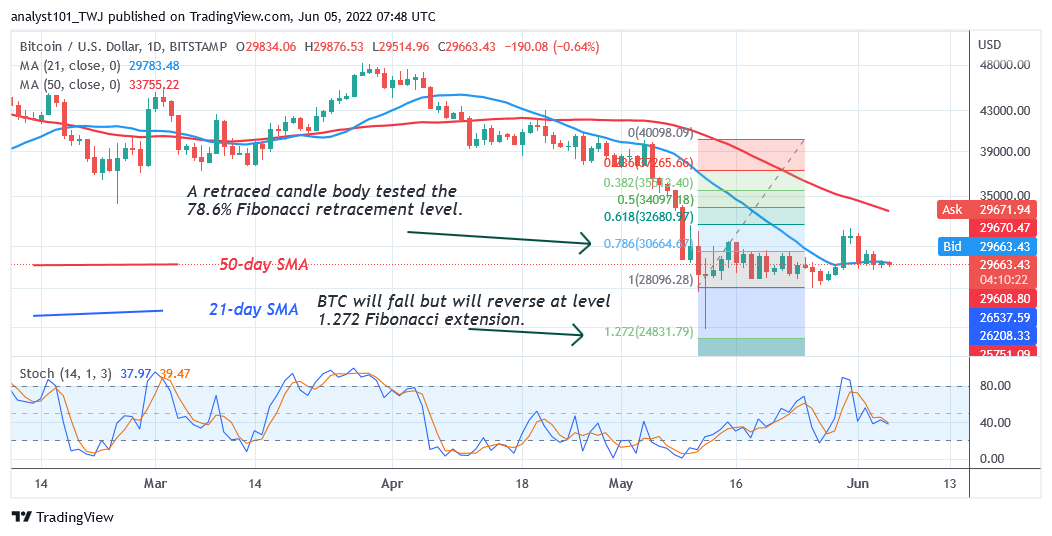
Nonetheless, on June 1, the bears pushed the crypto to the support above the 21-day line SMA. The selling pressure will resume and Bitcoin will decline to the crucial support above the $28,630. However, the downtrend will resume when the crucial support is breached. Meanwhile, BTC’s price is at 43 of the Relative Strength Index period 14. It indicates that Bitcoin is still in the bearish trend zone and capable of further decline.
SAND/USD Major Trend: Bearish
The Sandbox (SAND) price is in a downtrend and the cryptocurrency has fallen significantly from the high of $8. The current fall has reached the oversold region as the market declined to the low of 1.27 price level.
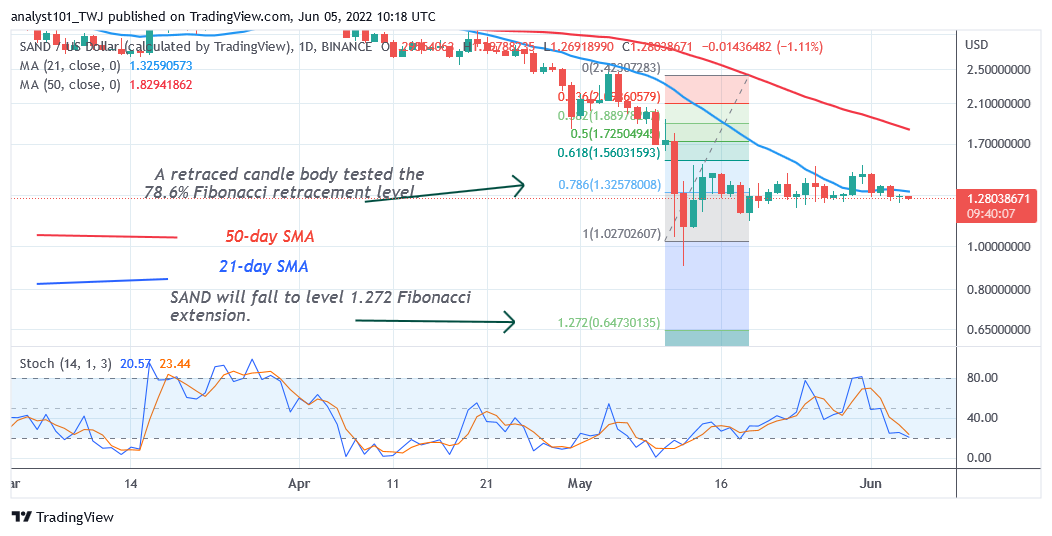
Since May 12 price slump, the SAND has been trading above the $1.26 support. Buyers have failed to push the altcoin to the previous highs. On May 31, the altcoin reached the high of $1.52 after breaking above the 21-day line SMA but was repelled. The altcoin has retraced below the 21-day line moving average. Meanwhile, on May 12 downtrend; a retraced candle body tested the 78.6% Fibonacci retracement level. The retracement indicates that the altcoin will fall but reverse at level 1.272 Fibonacci extension or $0.64 price level.
MANA/USD Major Trend: Bearish
Decentraland (MANA) is still in a downward move as price breaks below the moving averages. The cryptocurrency has fallen to the low of $0.96. The current price level is the historical price level of August 2021.
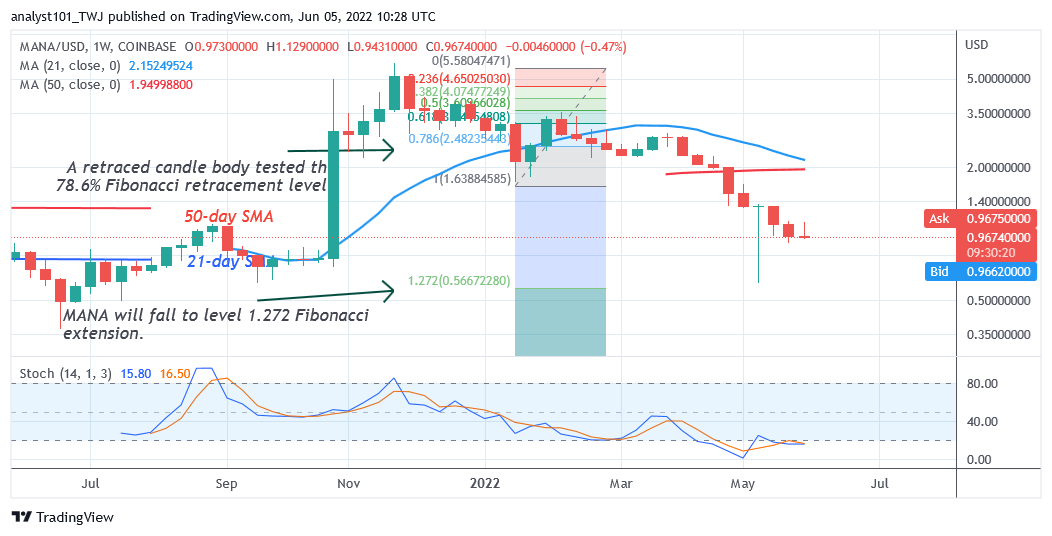
Meanwhile, on a weekly chart, a retraced candle body tested the 78.6% Fibonacci retracement level on January 31. The retracement suggests that MANA will fall but reversed at level 1.272 Fibonacci extension or $0.566. From the price action, the market has reached a low of $0.96. The cryptocurrency has fallen below the 20% range of the daily stochastic. It indicates that MANA has reached the oversold region of the market.
APE /USD Major Trend: Bearish
ApeCoin’s (APE) price is in a downtrend as it revisits the previous low at $5.16. Today, the cryptocurrency has fallen to the low of $6.07 at the time of writing.
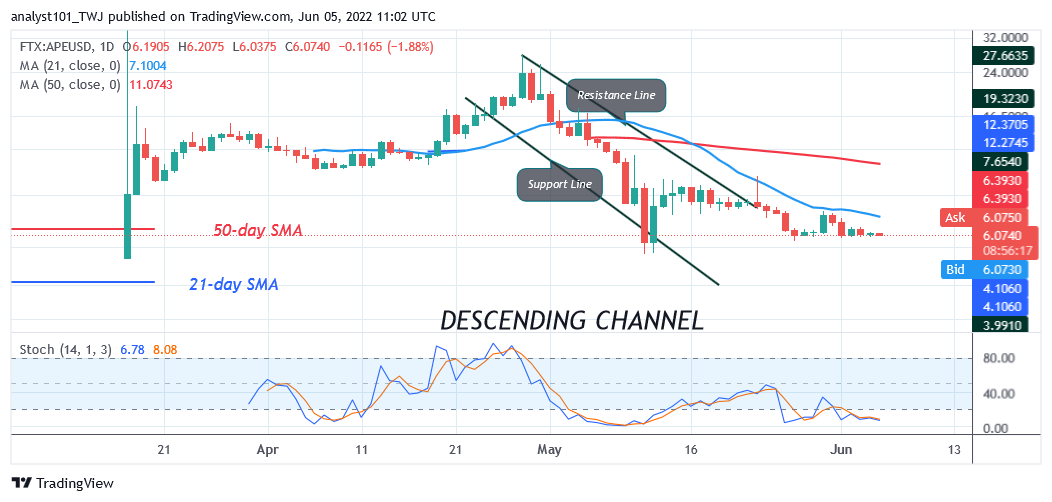
The coin is approaching the previous low of $5.24. The altcoin will find support above the previous low and resume an uptrend.In the meantime, the coin is below the 20% range of the daily stochastic. ApeCoin has fallen to the oversold region of the market. The downtrend has reached bearish exhaustion. Buyers are expected to emerge to push prices upward.
ENJ /USD Major Trend: Bearish
Enjin Coin (ENJ) is in a downward correction as the cryptocurrency fell to the low of $0.60. The cryptocurrency’s upward move has been restricted by the 21-day line SMA.
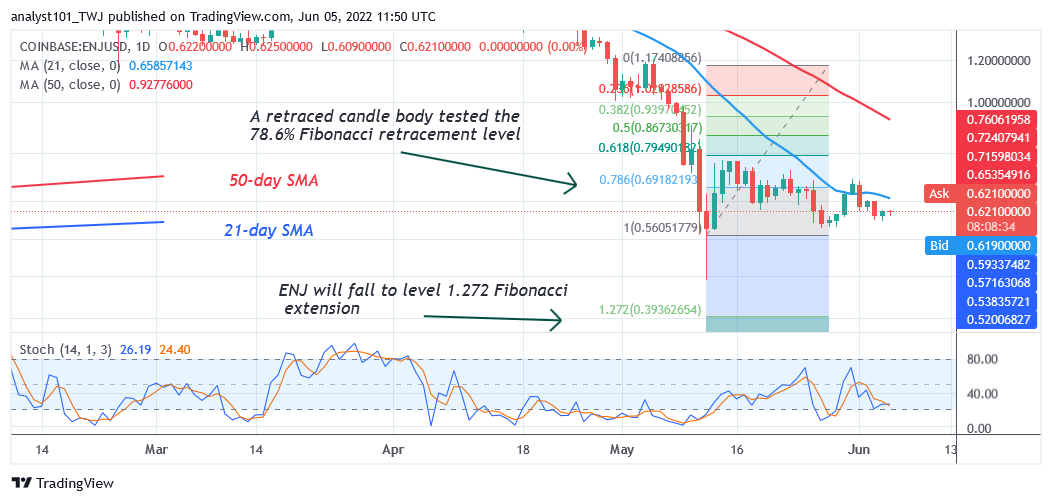
On May 31, the altcoin rallied to the high of $0.71 but faces rejection at the recent high. ENJ Coin is retracing to the current support at $0.57. On the downside, if the bears break below the $0.57 support, the market will decline to the previous low at $0.46. Meanwhile, on May 12 downtrend, a retraced candle body tested the 78.6% Fibonacci retracement level. The retracement indicates that ENJ will fall to level 1.272 Fibonacci extension or $0.39.


